Industrial Meter Reader#
This Jupyter notebook can be launched on-line, opening an interactive environment in a browser window. You can also make a local installation. Choose one of the following options:


This notebook shows how to create a industrial meter reader with OpenVINO Runtime. We use the pre-trained PPYOLOv2 PaddlePaddle model and DeepLabV3P to build up a multiple inference task pipeline:
Run detection model to find the meters, and crop them from the origin photo.
Run segmentation model on these cropped meters to get the pointer and scale instance.
Find the ___location of the pointer in scale map.
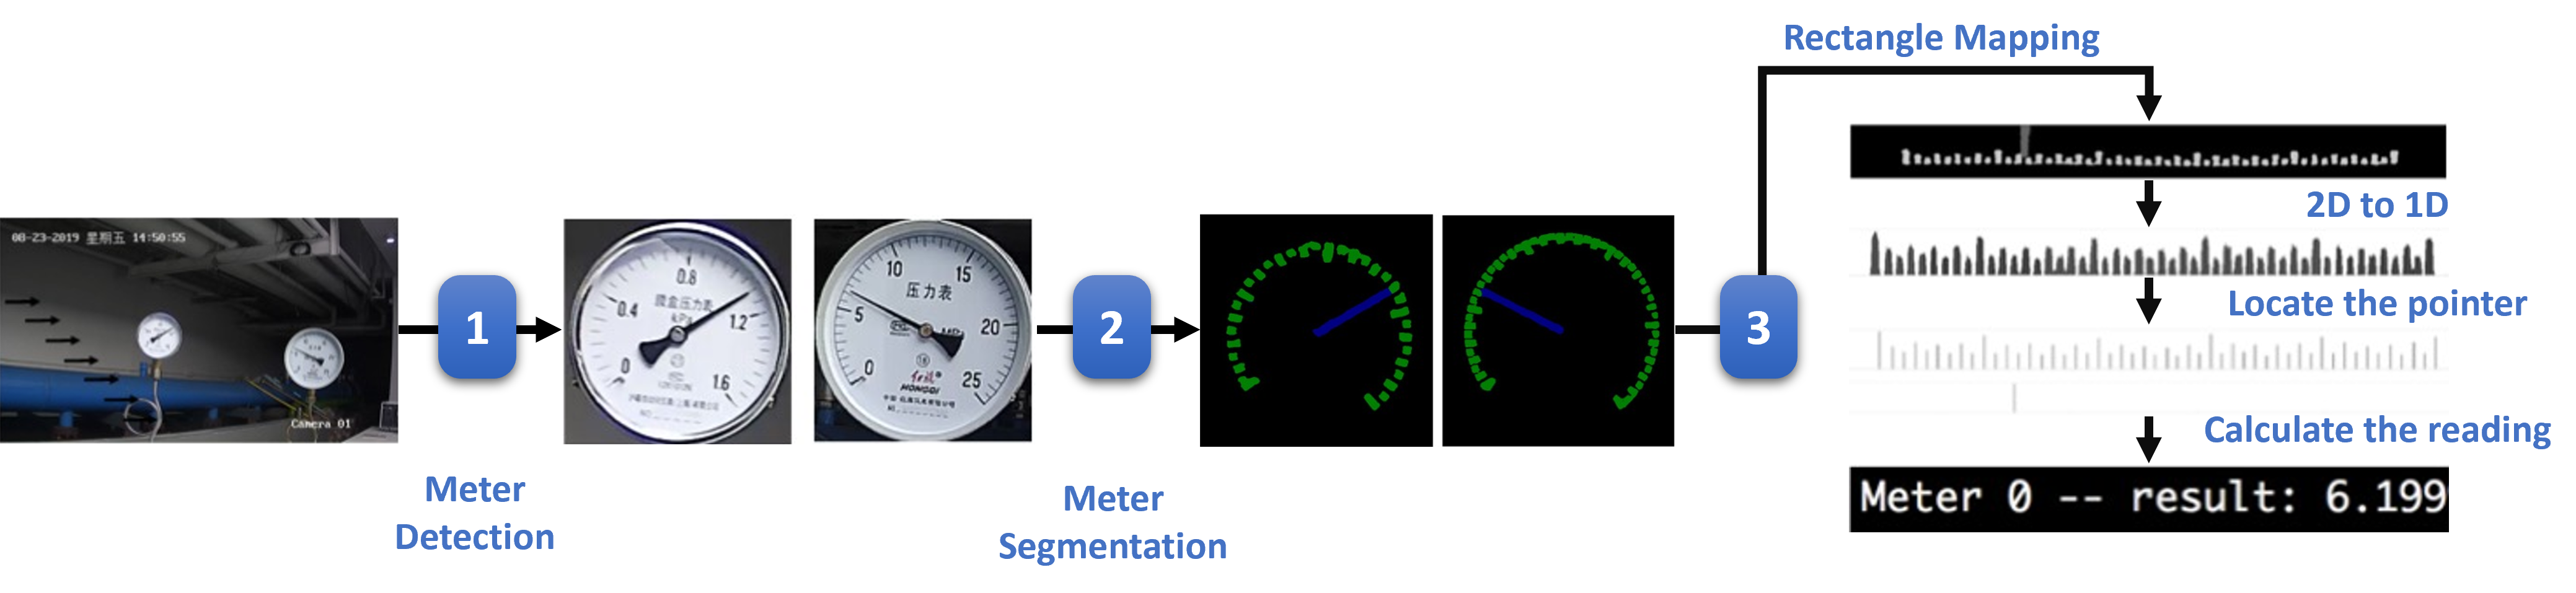
workflow#
Table of contents:
Installation Instructions#
This is a self-contained example that relies solely on its own code.
We recommend running the notebook in a virtual environment. You only need a Jupyter server to start. For details, please refer to Installation Guide.
# Install openvino package
%pip install -q "openvino>=2023.1.0" opencv-python tqdm "matplotlib>=3.4"
Note: you may need to restart the kernel to use updated packages.
Import#
import os
from pathlib import Path
import numpy as np
import math
import cv2
import tarfile
import matplotlib.pyplot as plt
import openvino as ov

# Fetch `notebook_utils` module
import requests

r = requests.get(
    url="https://raw.githubusercontent.com/openvinotoolkit/openvino_notebooks/latest/utils/notebook_utils.py",
)

open("notebook_utils.py", "w").write(r.text)
from notebook_utils import download_file, segmentation_map_to_image, device_widget
Prepare the Model and Test Image#
Download PPYOLOv2 and DeepLabV3P pre-trained models from PaddlePaddle community.
MODEL_DIR = "model"
DATA_DIR = "data"
DET_MODEL_LINK = "https://storage.openvinotoolkit.org/repositories/openvino_notebooks/models/meter-reader/meter_det_model.tar.gz"
SEG_MODEL_LINK = "https://storage.openvinotoolkit.org/repositories/openvino_notebooks/models/meter-reader/meter_seg_model.tar.gz"
DET_FILE_NAME = DET_MODEL_LINK.split("/")[-1]
SEG_FILE_NAME = SEG_MODEL_LINK.split("/")[-1]
IMG_LINK = "https://user-images.githubusercontent.com/91237924/170696219-f68699c6-1e82-46bf-aaed-8e2fc3fa5f7b.jpg"
IMG_FILE_NAME = IMG_LINK.split("/")[-1]
IMG_PATH = Path(f"{DATA_DIR}/{IMG_FILE_NAME}")

os.makedirs(MODEL_DIR, exist_ok=True)

download_file(DET_MODEL_LINK, directory=MODEL_DIR, show_progress=True)
file = tarfile.open(f"model/{DET_FILE_NAME}")
res = file.extractall("model")
if not res:
    print(f'Detection Model Extracted to "./{MODEL_DIR}".')
else:
    print("Error Extracting the Detection model. Please check the network.")

download_file(SEG_MODEL_LINK, directory=MODEL_DIR, show_progress=True)
file = tarfile.open(f"model/{SEG_FILE_NAME}")
res = file.extractall("model")
if not res:
    print(f'Segmentation Model Extracted to "./{MODEL_DIR}".')
else:
    print("Error Extracting the Segmentation model. Please check the network.")

download_file(IMG_LINK, directory=DATA_DIR, show_progress=True)
if IMG_PATH.is_file():
    print(f'Test Image Saved to "./{DATA_DIR}".')
else:
    print("Error Downloading the Test Image. Please check the network.")
meter_det_model.tar.gz: 0%| | 0.00/192M [00:00<?, ?B/s]
Detection Model Extracted to "./model".
meter_seg_model.tar.gz: 0%| | 0.00/94.9M [00:00<?, ?B/s]
Segmentation Model Extracted to "./model".
170696219-f68699c6-1e82-46bf-aaed-8e2fc3fa5f7b.jpg: 0%| | 0.00/183k [00:00<?, ?B/s]
Test Image Saved to "./data".
Configuration#
Add parameter configuration for reading calculation.
METER_SHAPE = [512, 512]
CIRCLE_CENTER = [256, 256]
CIRCLE_RADIUS = 250
PI = math.pi
RECTANGLE_HEIGHT = 120
RECTANGLE_WIDTH = 1570
TYPE_THRESHOLD = 40
COLORMAP = np.array([[28, 28, 28], [238, 44, 44], [250, 250, 250]])

# There are 2 types of meters in test image datasets
METER_CONFIG = [
    {"scale_interval_value": 25.0 / 50.0, "range": 25.0, "unit": "(MPa)"},
    {"scale_interval_value": 1.6 / 32.0, "range": 1.6, "unit": "(MPa)"},
]

SEG_LABEL = {"background": 0, "pointer": 1, "scale": 2}
Load the Models#
Define a common class for model loading and inference
# Initialize OpenVINO Runtime
core = ov.Core()


class Model:
    """
    This class represents a OpenVINO model object.

    """

    def __init__(self, model_path, new_shape, device="CPU"):
        """
        Initialize the model object

        Param:
            model_path (string): path of inference model
            new_shape (dict): new shape of model input

        """
        self.model = core.read_model(model=model_path)
        self.model.reshape(new_shape)
        self.compiled_model = core.compile_model(model=self.model, device_name=device)
        self.output_layer = self.compiled_model.output(0)

    def predict(self, input_image):
        """
        Run inference

        Param:
            input_image (np.array): input data

        Retuns:
            result (np.array)): model output data
        """
        result = self.compiled_model(input_image)[self.output_layer]
        return result
Data Process#
Including the preprocessing and postprocessing tasks of each model.
def det_preprocess(input_image, target_size):
    """
    Preprocessing the input data for detection task

    Param:
        input_image (np.array): input data
        size (int): the image size required by model input layer
    Retuns:
        img.astype (np.array): preprocessed image

    """
    img = cv2.resize(input_image, (target_size, target_size))
    img = np.transpose(img, [2, 0, 1]) / 255
    img = np.expand_dims(img, 0)
    img_mean = np.array([0.485, 0.456, 0.406]).reshape((3, 1, 1))
    img_std = np.array([0.229, 0.224, 0.225]).reshape((3, 1, 1))
    img -= img_mean
    img /= img_std
    return img.astype(np.float32)


def filter_bboxes(det_results, score_threshold):
    """
    Filter out the detection results with low confidence

    Param:
        det_results (list[dict]): detection results
        score_threshold (float): confidence threshold

    Retuns:
        filtered_results (list[dict]): filter detection results

    """
    filtered_results = []
    for i in range(len(det_results)):
        if det_results[i, 1] > score_threshold:
            filtered_results.append(det_results[i])
    return filtered_results


def roi_crop(image, results, scale_x, scale_y):
    """
    Crop the area of detected meter of original image

    Param:
        img (np.array):original image。
        det_results (list[dict]): detection results
        scale_x (float): the scale value in x axis
        scale_y (float): the scale value in y axis

    Retuns:
        roi_imgs (list[np.array]): the list of meter images
        loc (list[int]): the list of meter locations

    """
    roi_imgs = []
    loc = []
    for result in results:
        bbox = result[2:]
        xmin, ymin, xmax, ymax = [
            int(bbox[0] * scale_x),
            int(bbox[1] * scale_y),
            int(bbox[2] * scale_x),
            int(bbox[3] * scale_y),
        ]
        sub_img = image[ymin : (ymax + 1), xmin : (xmax + 1), :]
        roi_imgs.append(sub_img)
        loc.append([xmin, ymin, xmax, ymax])
    return roi_imgs, loc


def roi_process(input_images, target_size, interp=cv2.INTER_LINEAR):
    """
    Prepare the roi image of detection results data
    Preprocessing the input data for segmentation task

    Param:
        input_images (list[np.array]):the list of meter images
        target_size (list|tuple): height and width of resized image, e.g [heigh,width]
        interp (int):the interp method for image reszing

    Retuns:
        img_list (list[np.array]):the list of processed images
        resize_img (list[np.array]): for visualization

    """
    img_list = list()
    resize_list = list()
    for img in input_images:
        img_shape = img.shape
        scale_x = float(target_size[1]) / float(img_shape[1])
        scale_y = float(target_size[0]) / float(img_shape[0])
        resize_img = cv2.resize(img, None, None, fx=scale_x, fy=scale_y, interpolation=interp)
        resize_list.append(resize_img)
        resize_img = resize_img.transpose(2, 0, 1) / 255
        img_mean = np.array([0.5, 0.5, 0.5]).reshape((3, 1, 1))
        img_std = np.array([0.5, 0.5, 0.5]).reshape((3, 1, 1))
        resize_img -= img_mean
        resize_img /= img_std
        img_list.append(resize_img)
    return img_list, resize_list


def erode(seg_results, erode_kernel):
    """
    Erode the segmentation result to get the more clear instance of pointer and scale

    Param:
        seg_results (list[dict]):segmentation results
        erode_kernel (int): size of erode_kernel

    Return:
        eroded_results (list[dict]): the lab map of eroded_results

    """
    kernel = np.ones((erode_kernel, erode_kernel), np.uint8)
    eroded_results = seg_results
    for i in range(len(seg_results)):
        eroded_results[i] = cv2.erode(seg_results[i].astype(np.uint8), kernel)
    return eroded_results


def circle_to_rectangle(seg_results):
    """
    Switch the shape of label_map from circle to rectangle

    Param:
        seg_results (list[dict]):segmentation results

    Return:
        rectangle_meters (list[np.array]):the rectangle of label map

    """
    rectangle_meters = list()
    for i, seg_result in enumerate(seg_results):
        label_map = seg_result

        # The size of rectangle_meter is determined by RECTANGLE_HEIGHT and RECTANGLE_WIDTH
        rectangle_meter = np.zeros((RECTANGLE_HEIGHT, RECTANGLE_WIDTH), dtype=np.uint8)
        for row in range(RECTANGLE_HEIGHT):
            for col in range(RECTANGLE_WIDTH):
                theta = PI * 2 * (col + 1) / RECTANGLE_WIDTH

                # The radius of meter circle will be mapped to the height of rectangle image
                rho = CIRCLE_RADIUS - row - 1
                y = int(CIRCLE_CENTER[0] + rho * math.cos(theta) + 0.5)
                x = int(CIRCLE_CENTER[1] - rho * math.sin(theta) + 0.5)
                rectangle_meter[row, col] = label_map[y, x]
        rectangle_meters.append(rectangle_meter)
    return rectangle_meters


def rectangle_to_line(rectangle_meters):
    """
    Switch the dimension of rectangle label map from 2D to 1D

    Param:
        rectangle_meters (list[np.array]):2D rectangle OF label_map。

    Return:
        line_scales (list[np.array]): the list of scales value
        line_pointers (list[np.array]):the list of pointers value

    """
    line_scales = list()
    line_pointers = list()
    for rectangle_meter in rectangle_meters:
        height, width = rectangle_meter.shape[0:2]
        line_scale = np.zeros((width), dtype=np.uint8)
        line_pointer = np.zeros((width), dtype=np.uint8)
        for col in range(width):
            for row in range(height):
                if rectangle_meter[row, col] == SEG_LABEL["pointer"]:
                    line_pointer[col] += 1
                elif rectangle_meter[row, col] == SEG_LABEL["scale"]:
                    line_scale[col] += 1
        line_scales.append(line_scale)
        line_pointers.append(line_pointer)
    return line_scales, line_pointers


def mean_binarization(data_list):
    """
    Binarize the data

    Param:
        data_list (list[np.array]):input data

    Return:
        binaried_data_list (list[np.array]):output data。

    """
    batch_size = len(data_list)
    binaried_data_list = data_list
    for i in range(batch_size):
        mean_data = np.mean(data_list[i])
        width = data_list[i].shape[0]
        for col in range(width):
            if data_list[i][col] < mean_data:
                binaried_data_list[i][col] = 0
            else:
                binaried_data_list[i][col] = 1
    return binaried_data_list


def locate_scale(line_scales):
    """
    Find ___location of center of each scale

    Param:
        line_scales (list[np.array]):the list of binaried scales value

    Return:
        scale_locations (list[list]):___location of each scale

    """
    batch_size = len(line_scales)
    scale_locations = list()
    for i in range(batch_size):
        line_scale = line_scales[i]
        width = line_scale.shape[0]
        find_start = False
        one_scale_start = 0
        one_scale_end = 0
        locations = list()
        for j in range(width - 1):
            if line_scale[j] > 0 and line_scale[j + 1] > 0:
                if not find_start:
                    one_scale_start = j
                    find_start = True
            if find_start:
                if line_scale[j] == 0 and line_scale[j + 1] == 0:
                    one_scale_end = j - 1
                    one_scale_location = (one_scale_start + one_scale_end) / 2
                    locations.append(one_scale_location)
                    one_scale_start = 0
                    one_scale_end = 0
                    find_start = False
        scale_locations.append(locations)
    return scale_locations


def locate_pointer(line_pointers):
    """
    Find ___location of center of pointer

    Param:
        line_scales (list[np.array]):the list of binaried pointer value

    Return:
        scale_locations (list[list]):___location of pointer

    """
    batch_size = len(line_pointers)
    pointer_locations = list()
    for i in range(batch_size):
        line_pointer = line_pointers[i]
        find_start = False
        pointer_start = 0
        pointer_end = 0
        ___location = 0
        width = line_pointer.shape[0]
        for j in range(width - 1):
            if line_pointer[j] > 0 and line_pointer[j + 1] > 0:
                if not find_start:
                    pointer_start = j
                    find_start = True
            if find_start:
                if line_pointer[j] == 0 and line_pointer[j + 1] == 0:
                    pointer_end = j - 1
                    ___location = (pointer_start + pointer_end) / 2
                    find_start = False
                    break
        pointer_locations.append(___location)
    return pointer_locations


def get_relative_location(scale_locations, pointer_locations):
    """
    Match ___location of pointer and scales

    Param:
        scale_locations (list[list]):___location of each scale
        pointer_locations (list[list]):___location of pointer

    Return:
        pointed_scales (list[dict]): a list of dict with:
                                     'num_scales': total number of scales
                                     'pointed_scale': predicted number of scales

    """
    pointed_scales = list()
    for scale_location, pointer_location in zip(scale_locations, pointer_locations):
        num_scales = len(scale_location)
        pointed_scale = -1
        if num_scales > 0:
            for i in range(num_scales - 1):
                if scale_location[i] <= pointer_location < scale_location[i + 1]:
                    pointed_scale = i + (pointer_location - scale_location[i]) / (scale_location[i + 1] - scale_location[i] + 1e-05) + 1
        result = {"num_scales": num_scales, "pointed_scale": pointed_scale}
        pointed_scales.append(result)
    return pointed_scales


def calculate_reading(pointed_scales):
    """
    Calculate the value of meter according to the type of meter

    Param:
        pointed_scales (list[list]):predicted number of scales

    Return:
        readings (list[float]): the list of values read from meter

    """
    readings = list()
    batch_size = len(pointed_scales)
    for i in range(batch_size):
        pointed_scale = pointed_scales[i]
        # find the type of meter according the total number of scales
        if pointed_scale["num_scales"] > TYPE_THRESHOLD:
            reading = pointed_scale["pointed_scale"] * METER_CONFIG[0]["scale_interval_value"]
        else:
            reading = pointed_scale["pointed_scale"] * METER_CONFIG[1]["scale_interval_value"]
        readings.append(reading)
    return readings
Main Function#
Initialize the model and parameters.#
select device from dropdown list for running inference using OpenVINO
device = device_widget()

device
Dropdown(description='Device:', index=1, options=('CPU', 'AUTO'), value='AUTO')
The number of detected meter from detection network can be arbitrary in
some scenarios, which means the batch size of segmentation network input
is a dynamic
dimension,
and it should be specified as -1 or the ov::Dimension() instead
of a positive number used for static dimensions. In this case, for
memory consumption optimization, we can specify the lower and/or upper
bounds of input batch size.
img_file = f"{DATA_DIR}/{IMG_FILE_NAME}"
det_model_path = f"{MODEL_DIR}/meter_det_model/model.pdmodel"
det_model_shape = {
"image": [1, 3, 608, 608],
"im_shape": [1, 2],
"scale_factor": [1, 2],
}
seg_model_path = f"{MODEL_DIR}/meter_seg_model/model.pdmodel"
seg_model_shape = {"image": [ov.Dimension(1, 2), 3, 512, 512]}
erode_kernel = 4
score_threshold = 0.5
seg_batch_size = 2
input_shape = 608
# Intialize the model objects
detector = Model(det_model_path, det_model_shape, device.value)
segmenter = Model(seg_model_path, seg_model_shape, device.value)
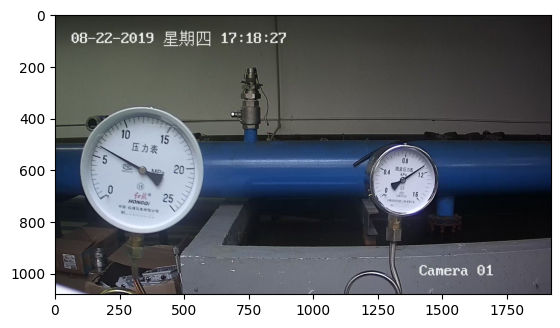
# Visulize a original input photo
image = cv2.imread(img_file)
rgb_image = cv2.cvtColor(image, cv2.COLOR_BGR2RGB)
plt.imshow(rgb_image)
<matplotlib.image.AxesImage at 0x7f1a979271f0>
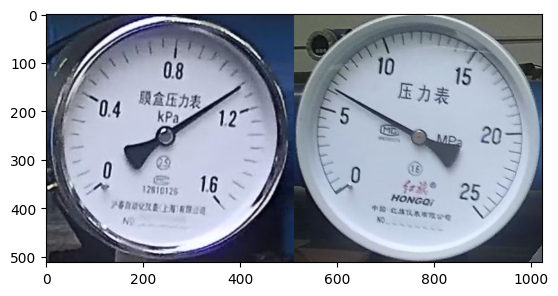
Run meter detection model#
Detect the ___location of the meter and prepare the ROI images for segmentation.
# Prepare the input data for meter detection model
im_shape = np.array([[input_shape, input_shape]]).astype("float32")
scale_factor = np.array([[1, 2]]).astype("float32")
input_image = det_preprocess(image, input_shape)
inputs_dict = {"image": input_image, "im_shape": im_shape, "scale_factor": scale_factor}

# Run meter detection model
det_results = detector.predict(inputs_dict)

# Filter out the bounding box with low confidence
filtered_results = filter_bboxes(det_results, score_threshold)

# Prepare the input data for meter segmentation model
scale_x = image.shape[1] / input_shape * 2
scale_y = image.shape[0] / input_shape

# Create the individual picture for each detected meter
roi_imgs, loc = roi_crop(image, filtered_results, scale_x, scale_y)
roi_imgs, resize_imgs = roi_process(roi_imgs, METER_SHAPE)

# Create the pictures of detection results
roi_stack = np.hstack(resize_imgs)

if cv2.imwrite(f"{DATA_DIR}/detection_results.jpg", roi_stack):
    print('The detection result image has been saved as "detection_results.jpg" in data')
    plt.imshow(cv2.cvtColor(roi_stack, cv2.COLOR_BGR2RGB))
The detection result image has been saved as "detection_results.jpg" in data
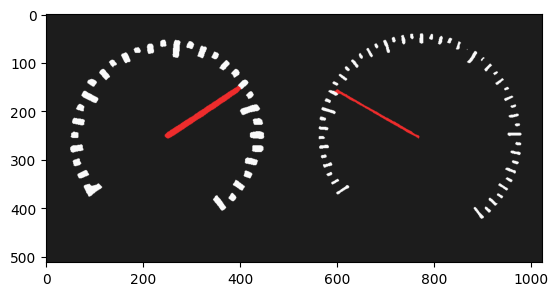
Run meter segmentation model#
Get the results of segmentation task on detected ROI.
seg_results = list()
mask_list = list()
num_imgs = len(roi_imgs)

# Run meter segmentation model on all detected meters
for i in range(0, num_imgs, seg_batch_size):
    batch = roi_imgs[i : min(num_imgs, i + seg_batch_size)]
    seg_result = segmenter.predict({"image": np.array(batch)})
    seg_results.extend(seg_result)
results = []
for i in range(len(seg_results)):
    results.append(np.argmax(seg_results[i], axis=0))
seg_results = erode(results, erode_kernel)

# Create the pictures of segmentation results
for i in range(len(seg_results)):
    mask_list.append(segmentation_map_to_image(seg_results[i], COLORMAP))
mask_stack = np.hstack(mask_list)

if cv2.imwrite(f"{DATA_DIR}/segmentation_results.jpg", cv2.cvtColor(mask_stack, cv2.COLOR_RGB2BGR)):
    print('The segmentation result image has been saved as "segmentation_results.jpg" in data')
    plt.imshow(mask_stack)
The segmentation result image has been saved as "segmentation_results.jpg" in data
Postprocess the models result and calculate the final readings#
Use OpenCV function to find the ___location of the pointer in a scale map.
# Find the pointer ___location in scale map and calculate the meters reading
rectangle_meters = circle_to_rectangle(seg_results)
line_scales, line_pointers = rectangle_to_line(rectangle_meters)
binaried_scales = mean_binarization(line_scales)
binaried_pointers = mean_binarization(line_pointers)
scale_locations = locate_scale(binaried_scales)
pointer_locations = locate_pointer(binaried_pointers)
pointed_scales = get_relative_location(scale_locations, pointer_locations)
meter_readings = calculate_reading(pointed_scales)

rectangle_list = list()
# Plot the rectangle meters
for i in range(len(rectangle_meters)):
    rectangle_list.append(segmentation_map_to_image(rectangle_meters[i], COLORMAP))
rectangle_meters_stack = np.hstack(rectangle_list)

if cv2.imwrite(
    f"{DATA_DIR}/rectangle_meters.jpg",
    cv2.cvtColor(rectangle_meters_stack, cv2.COLOR_RGB2BGR),
):
    print('The rectangle_meters result image has been saved as "rectangle_meters.jpg" in data')
    plt.imshow(rectangle_meters_stack)
The rectangle_meters result image has been saved as "rectangle_meters.jpg" in data
Get the reading result on the meter picture#
# Create a final result photo with reading
for i in range(len(meter_readings)):
    print("Meter {}: {:.3f}".format(i + 1, meter_readings[i]))

result_image = image.copy()
for i in range(len(loc)):
    cv2.rectangle(result_image, (loc[i][0], loc[i][1]), (loc[i][2], loc[i][3]), (0, 150, 0), 3)
    font = cv2.FONT_HERSHEY_SIMPLEX
    cv2.rectangle(
        result_image,
        (loc[i][0], loc[i][1]),
        (loc[i][0] + 100, loc[i][1] + 40),
        (0, 150, 0),
        -1,
    )
    cv2.putText(
        result_image,
        "#{:.3f}".format(meter_readings[i]),
        (loc[i][0], loc[i][1] + 25),
        font,
        0.8,
        (255, 255, 255),
        2,
        cv2.LINE_AA,
    )
if cv2.imwrite(f"{DATA_DIR}/reading_results.jpg", result_image):
    print('The reading results image has been saved as "reading_results.jpg" in data')
    plt.imshow(cv2.cvtColor(result_image, cv2.COLOR_BGR2RGB))
Meter 1: 1.100
Meter 2: 6.185
The reading results image has been saved as "reading_results.jpg" in data
