Note
Access to this page requires authorization. You can try signing in or changing directories.
Access to this page requires authorization. You can try changing directories.
In this end-to-end tutorial, you create an example translytical task flow that writes back to a SQL Database in Fabric. To help illustrate the end-to-end step-up experience, we focus on a translytical task flow for a data annotation scenario.
In this tutorial, you learn how to:
- Create a SQL database in Fabric.
- Configure a user data function that writes back to a SQL database.
- Integrate a user data function with a Power BI report.
If you don't have an existing Fabric capacity, start a Fabric trial.
Note
The translytical task flow feature is currently in public preview.
Prerequisites
- Enable required preview features in Power BI and Fabric.
- Enable SQL database in Fabric using admin portal tenant settings.
- Power BI Desktop. If you don't have Power BI Desktop installed on your device, follow the instructions in Get Power BI Desktop.
Overview
Creating a translytical task flow requires three tasks to enable your automated scenarios:
Store data
Start with an existing Fabric data source. In this tutorial, we use a SQL database with sample data.
Develop data
Write a Fabric user data function that gets called from a Power BI report. This function can do any number of actions, from editing the report's data source to sending a notification to creating a work item in an approvals pipeline. In this tutorial, we create a user data function that takes a new product description and writes it to the SQL database.
Visualize data
Create a Power BI report that displays the source data and interactive elements that call the data function. In this tutorial, we use a text slicer to collect the product description from the user and send it to the user data function. Then, the report refreshes to show the updated table.
Create a SQL database
This scenario uses the sample AdventureWorksLT dataset in SQL database.
Follow the steps in Create a SQL database in the Fabric portal.
Take note of the name that you give to the SQL database. You use this value later in the tutorial.
After you create the database, choose the Sample data option to load the AdventureWorksLT sample data into your empty database.
Create a user data function
Create a user data function in a workspace.
Navigate to the workspace of your choice in Power BI or Fabric.
Select New item.
Select User data functions (preview) from the Develop data group.
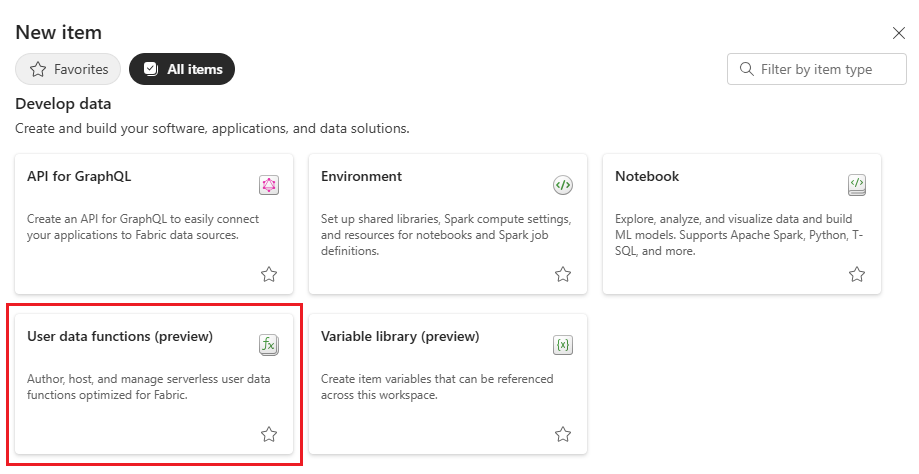
Provide a name for the new user data function, for example sqlwriteback, then select Create.
Take note of the name you use, and the workspace name. You use both of these values later in the tutorial.
Select New function.
Connect to your SQL database
Connect the user data function to the SQL database you created previously. Make sure that you have access permissions to the SQL database before continuing.
Select Manage connections on the page for your new user data function.

Select Add data connection.
Select the AdventureWorksLT SQL database that you created previously, then select Connect.
When the connection is created, an alias is automatically created for the connection. Take note of the Alias value to use later in the tutorial.

Close the Connections page to return to your user data function.
Add function code
Add code to your user data function so that it writes data to the [SalesLT].[ProductDescription] table in the SQL database's AdventureWorksLT sample.
User data functions use pyodbc by default for SQL connections, and we recommend that library for this scenario.
To connect a user data function to a Power BI button, the function must return a string.
Replace the default code in your user data function with the following sample:
import fabric.functions as fn
import uuid

udf = fn.UserDataFunctions()

@udf.connection(argName="sqlDB",alias="<REPLACE_WITH_CONNECTION_ALIAS>")
@udf.function()

# Take a product description and product model ID as input parameters and write them back to the SQL database
# Users will provide these parameters in the PowerBI report
def write_one_to_sql_db(sqlDB: fn.FabricSqlConnection, productDescription: str, productModelId:int) -> str:

    # Error handling to ensure product description doesn't go above 200 characters
    if(len(productDescription) > 200):
        raise fn.UserThrownError("Descriptions have a 200 character limit. Please shorten your description.", {"Description:": productDescription})

    # Establish a connection to the SQL database
    connection = sqlDB.connect()
    cursor = connection.cursor()

    # Insert data into the ProductDescription table
    insert_description_query = "INSERT INTO [SalesLT].[ProductDescription] (Description) OUTPUT INSERTED.ProductDescriptionID VALUES (?)"
    cursor.execute(insert_description_query, productDescription)

    # Get the result from the previous query
    results = cursor.fetchall()

    # In real-world cases, call an API to retrieve the cultureId
    # For this example, generate a random Id instead
    cultureId = str(uuid.uuid4())

    # Insert data into the ProductModelProductDescription table
    insert_model_description_query = "INSERT INTO [SalesLT].[ProductModelProductDescription] (ProductModelID, ProductDescriptionID, Culture) VALUES (?, ?, ?);"
    cursor.execute(insert_model_description_query, (productModelId, results[0][0], cultureId[:6]))

    # Commit the transaction
    connection.commit()
    cursor.close()
    connection.close()

    return "Product description was added"
Find the following line of code in the sample:
@udf.connection(argName="sqlDB",alias="<REPLACE_WITH_CONNECTION_ALIAS>")Replace the alias placeholder with the alias value from the previous section.
You can open the Manage connections page again to view the connection alias.
Test the sample code
Use the steps in this section if you want to test the sample code so far.
Select Publish.
Once the function is published, hover over the write_one_to_sql_db function on the Functions explorer menu, then select the Run icon.
On the Run page, provide sample data for the two required parameters:
- productDescription: string
- productModelId: integer between 1 and 127
Select Run.
Review the function output and the generated logs.
Close the Run page when you're done testing.
If you get any errors when running the sample code, check that your account has access permissions to the database.
Grant user permissions (optional)
If other users interact with the Power BI report that calls this function, grant them Execute functions permissions.
On the functions page, select Share.
Select the first box of the Create and send link pop-up window.
Select Execute Functions and View Functions Logs from the Additional permissions list, then select Apply.

In the Enter a name or email address box, provide the users or groups that you want to have permissions for this function.
Select Send.
Create a Power BI report
In this section, you create a Power BI report that pulls data from the SQL database you created in the previous section.
Connect to the SQL database
Connect to your SQL database as the data source for your report.
In Power BI Desktop, create a new report.
Select OneLake Catalog > SQL database.

In the OneLake catalog window, select the database that you created in the previous section. For example, AdventureWorksLT. Then, select Connect.
Follow any prompts to authenticate to the database.
Once you successfully connect to the database, the Navigator window opens. Select the following tables, then select Load:
SalesLT.ProductDescriptionSalesLT.ProductModelSalesLT.ProductModelProductDescription

When prompted, choose DirectQuery as the connection mode, then select Ok.
DirectQuery mode is a live connection that enables the report to refresh the data and reflect any data modifications. For more information, see DirectQuery in Power BI.
Build the Power BI report
In this section, build visuals with the data that you loaded into your Power BI report.
In the Data menu, select the following columns:
SalesLT.ProductModel>NameSalesLT.ProductModelProductDescription>ProductModelID

A two-column table appears in your report window.

In the Visualizations menu, select the Text slicer icon.

Tip
If you don't see the text slicer icon, make sure that the Text slicer preview feature is enabled in Power BI Desktop. For more information, see Required preview features.
A text slicer visual appears in your report window.

Select the text slicer and use the Format visual > General > Title options to give the text slicer the following title:
Write a new product description.On the taskbar, select the Insert menu and add a Blank button to the report. Drag the button under the text slicer.

Select the button and expand the Action options in the Format button pane. Turn the Action radio button to On.
Provide the following values for your button:
Parameter Value Type Select Data function Workspace Select the workspace that contains the user data function you made in the previous section. Function Set Select the function set that contains your data function. For example, sqlwriteback. Data function Select your data function. For example, write_one_to_sql_db. Tip
If you don't see the Data function option, make sure that the Translytical task flows preview feature is enabled in Power BI desktop.
If you do see the Data function option but don't see your user data function, make sure that your data function returns a string.
Once you select your data function, more parameters appear to represent the parameters that the function takes. Provide the following values:
Parameter Value productDescription Select the text slicer from your report, Write a new product description. productModelId Select the Conditional formatting (fx) button. A new window opens.
For the Format style parameter, keep the default Field value value.
For the What field should we base this on? parameter, select All data > SalesLT.ProductModel > ProductModelID.Summarization Select Maximum. Select OK to complete the action configuration. The Action details should look like the following example:

Select the button and expand the Style options in the Format button pane. Turn the Text radio button to On and label your button
Enter.In the Style options, switch the Apply settings to option to Loading.
The loading state is a unique state available to data function buttons that you can use to define style options that appear while the data function is running.

Expand the Text menu and replace the button text value with
Submitting.Expand the Icon menu.
By default, a data function button has a Spinner icon type for the loading state.
Adjust the icon style with the following changes:
Parameter Value Padding Change the left padding to 20 px.Icon size Replace the default Auto value with 20.In the Visualizations pane, select the Table icon to insert a new table.
In the Data pane, select the following columns to add to your table:
SalesLT.ProductModel>NameSalesLT.ProductDescription>DescriptionSalesLT.ProductDescription>ModifiedDate

Optional report modifications
As with any Power BI report, there are many ways to customize the appearance and improve the functionality of this report. Consider some of these options:
- Add titles to the two tables. For example, Select a product and Product description.
- Set the text slicer to autoclear after submitting a new product description. To do so, select the button that triggers the user data function. In the Format button > Action menu, set the Auto clear toggle to On.
- Opt-out of autorefresh for the report after triggering the user data function. In this scenario, it's helpful to refresh the data and see the new product description appear in the table. In other scenarios, you might not need or want to refresh the report. To turn off this setting, select the button that triggers the user data function. In the Format button > Action menu, set the Refresh the report after a successful outcome toggle to Off.
Run your translytical task flow
You can test the functionality of your translytical task flow in Power BI Desktop. But if you want to see the most accurate end-user experience, publish the report to Power BI service and test it in the web.
Publish your report
You built your report in Power BI Desktop. In this section, you publish the report so that your users can interact with it in the web portal.
In the Home toolbar menu, select Publish.
Select the Power BI workspace where you want to publish this report, then select Select.
Once your report finishes publishing, select the link to Open <REPORT_NAME>.pbix in Power BI.
Tip
When you open your report in the Power BI web portal, you might see an error that says, The data source is missing credentials and cannot be accessed. To resolve this error, use the following steps:
- Open the semantic model for your report and navigate to File > Settings.
- Expand the Data source credentials setting if it isn't already.
- Select Edit credentials.
- Choose your Authentication method from the dropdown menu. For example, Basic takes a username and password, and OAuth2 enables single sign-on with your current account.
- Provide the required information, if any, then select Sign in.
Now, you have a translytical task flow in a Power BI report that's available in the Power BI service.
Run your translytical task flow
In this section, you interact with your report in the Power BI web portal to test the translytical task flow that you built.
Only users that are authorized to trigger data functions can use this feature. Any unauthorized users get a Something went wrong response.
- Open your report in Power BI.
- Select a product from the product table that lists the name and ID. This selection passes context to the text slicer for which product you want to update. You also see that the product description table filters to show all of the current descriptions for the selected product.
- Write a new product description in the input text box.
- Select the arrow icon or use the Tab key to submit the input. Once a product is selected and a description is provided, you see that the button switches to an enabled state.
- Select the button to run the user data function.
If the translytical task flow worked correctly, you receive a message that says The action on your report was submitted successfully. The product description table refreshes to show the new description.
If anything goes wrong with the translytical task flow, you receive a message that says Something went wrong. Select View details to get more information about the reason for the failure. Some common reasons for an unsuccessful function run include:
- Data validation: Input values don't meet the data validation rules defined in the user data function.
- Timeout error: A function or process takes longer than the allowed time to complete.
- Improper setup: Errors in configuring the report elements, usually the button, can cause the task flow to fail or product unexpected results.
- Unauthorized user: The user doesn't have permissions to trigger the data function.
Next steps
- To get ideas for translytical task flows that you can incorporate into your workflows, see Translytical task flow examples.
- To learn more about options for integrating data function buttons into Power BI reports, see Create a data function button in Power BI.