Application Insights collects telemetry from your application to help diagnosing failures and investigating slow transactions. It includes four essential tools:
Failures - Tracks errors, exceptions, and faults, offering clear insights for fast problem-solving and enhanced stability.
Performance - Quickly identifies and helps resolve application bottlenecks by displaying response times and operation counts.
Transaction search - Enables users to locate and examine individual telemetry items such as page views, exceptions, and custom events.
Transaction diagnostics - Helps to quickly identify issues in components through comprehensive insight into end-to-end transaction details.
Together, these tools ensure the ongoing health and efficiency of web applications. You can use them to pinpoint issues or enhancements that would have the most impact on users.
To get to the Failures view in Application Insights, select either the Failed requests graph on the Overview pane, or Failures under the Investigate category in the resource menu.

You can also get to the failures view from the Application Map by selecting a resource, then Investigate failures from the triage section.


Note
You can access Transaction diagnostics through any of the other three experiences. For more information, see Investigate telemetry.
Overview
The Failures view shows a list of all failed operations collected for your application with the option to drill into each one. It lets you view their frequency and the number of users affected, to help you focus your efforts on the issues with the highest impact.


Note
In addition to the out-of-the-box telemetry sent by the Azure Monitor OpenTelemetry Distro or JavaScript SDK, you can add and modify telemetry (for example, custom events).
For more information, see Add and modify Azure Monitor OpenTelemetry for .NET, Java, Node.js, and Python applications.
Filter telemetry
Default filters
All experiences allow you to filter telemetry by time range. In addition, each experience comes with its own default filter:
You can select which service (Cloud Role Name) or machine/container (Cloud Role Instance) to view from the Roles filter menu. This allows you to isolate issues or performance trends within specific parts of your application.
To learn how to set the Cloud Role Name and the Cloud Role Instance, see Configure Azure Monitor OpenTelemetry.
Add filters
You can filter events on the values of their properties. The available properties depend on the event or telemetry types you selected. To add a filter:
Select
 to add a filter.
From the left dropdown list, select a property.
From the center dropdown list, select one of the following operators:
=,!=,contains, ornot contains.From the right dropdown list, select all property values you want to filter on.
Note
Notice that the counts to the right of the filter values show how many occurrences there are in the current filtered set.
To add another filter, select
again.
Search telemetry
You can search for specific operations using the Search to filter items... field above the operations list.


Use analytics data
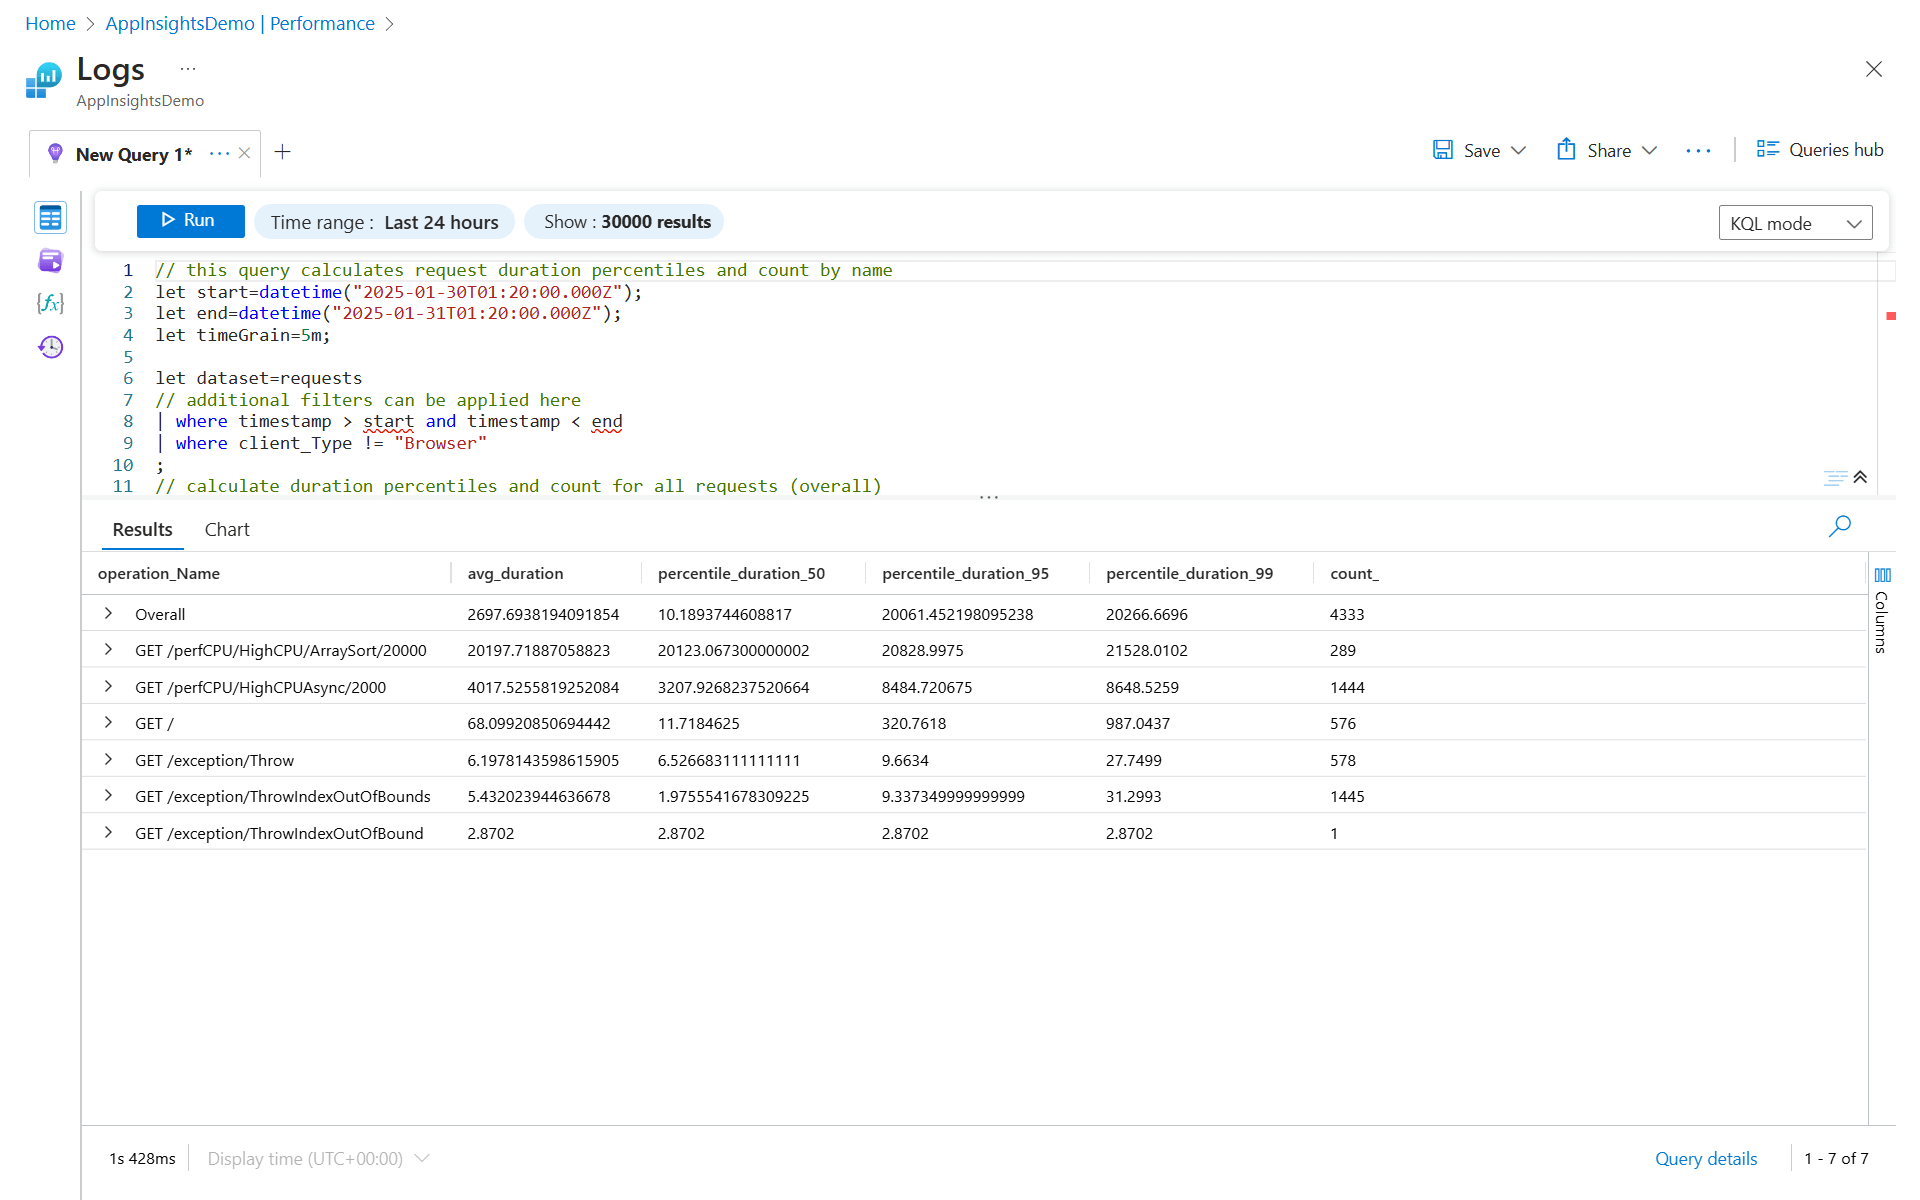
All data collected by Application Insights is stored in Log Analytics, which provides a rich query language to analyze the requests that generated the exception you're investigating.
Tip
Simple mode in Log Analytics offers an intuitive point-and-click interface for analyzing and visualizing log data.
On either the performance, failures, or transaction search view, select View in Logs in the top navigation bar and pick a query from the dropdown menu.

This takes you to the Logs view, where you can further modify the query or select a different one from the sidebar.


Investigate telemetry
To investigate the root cause of an error or exception, you can drill into the problematic operation for a detailed end-to-end transaction details view that includes dependencies and exception details.
Select an operation to view the Top 3 response codes, Top 3 exception types, and Top 3 failed dependencies for that operation.
Under Drill into, select the button with the number of filtered results to view a list of sample operations.
Select a sample operation to open the End-to-end transaction details view.

Note
The Suggested samples have related telemetry from all components, even if sampling was in effect in any of them.


Analyze client-side performance and failures
If you instrument your web pages with Application Insights, you can gain visibility into page views, browser operations, and dependencies. Collecting this browser data requires adding a script to your web pages.
After you add the script, you can access page views and their associated performance metrics by selecting the Browser toggle on the Performance or Failures view.
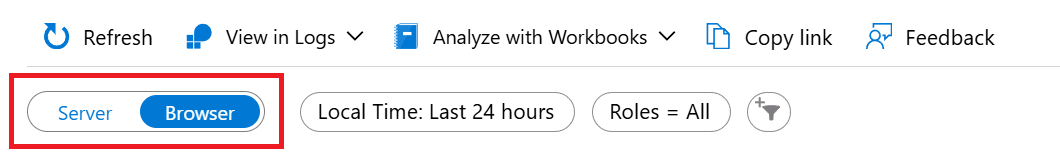
This view provides a visual summary of various telemetries of your application from the perspective of the browser.
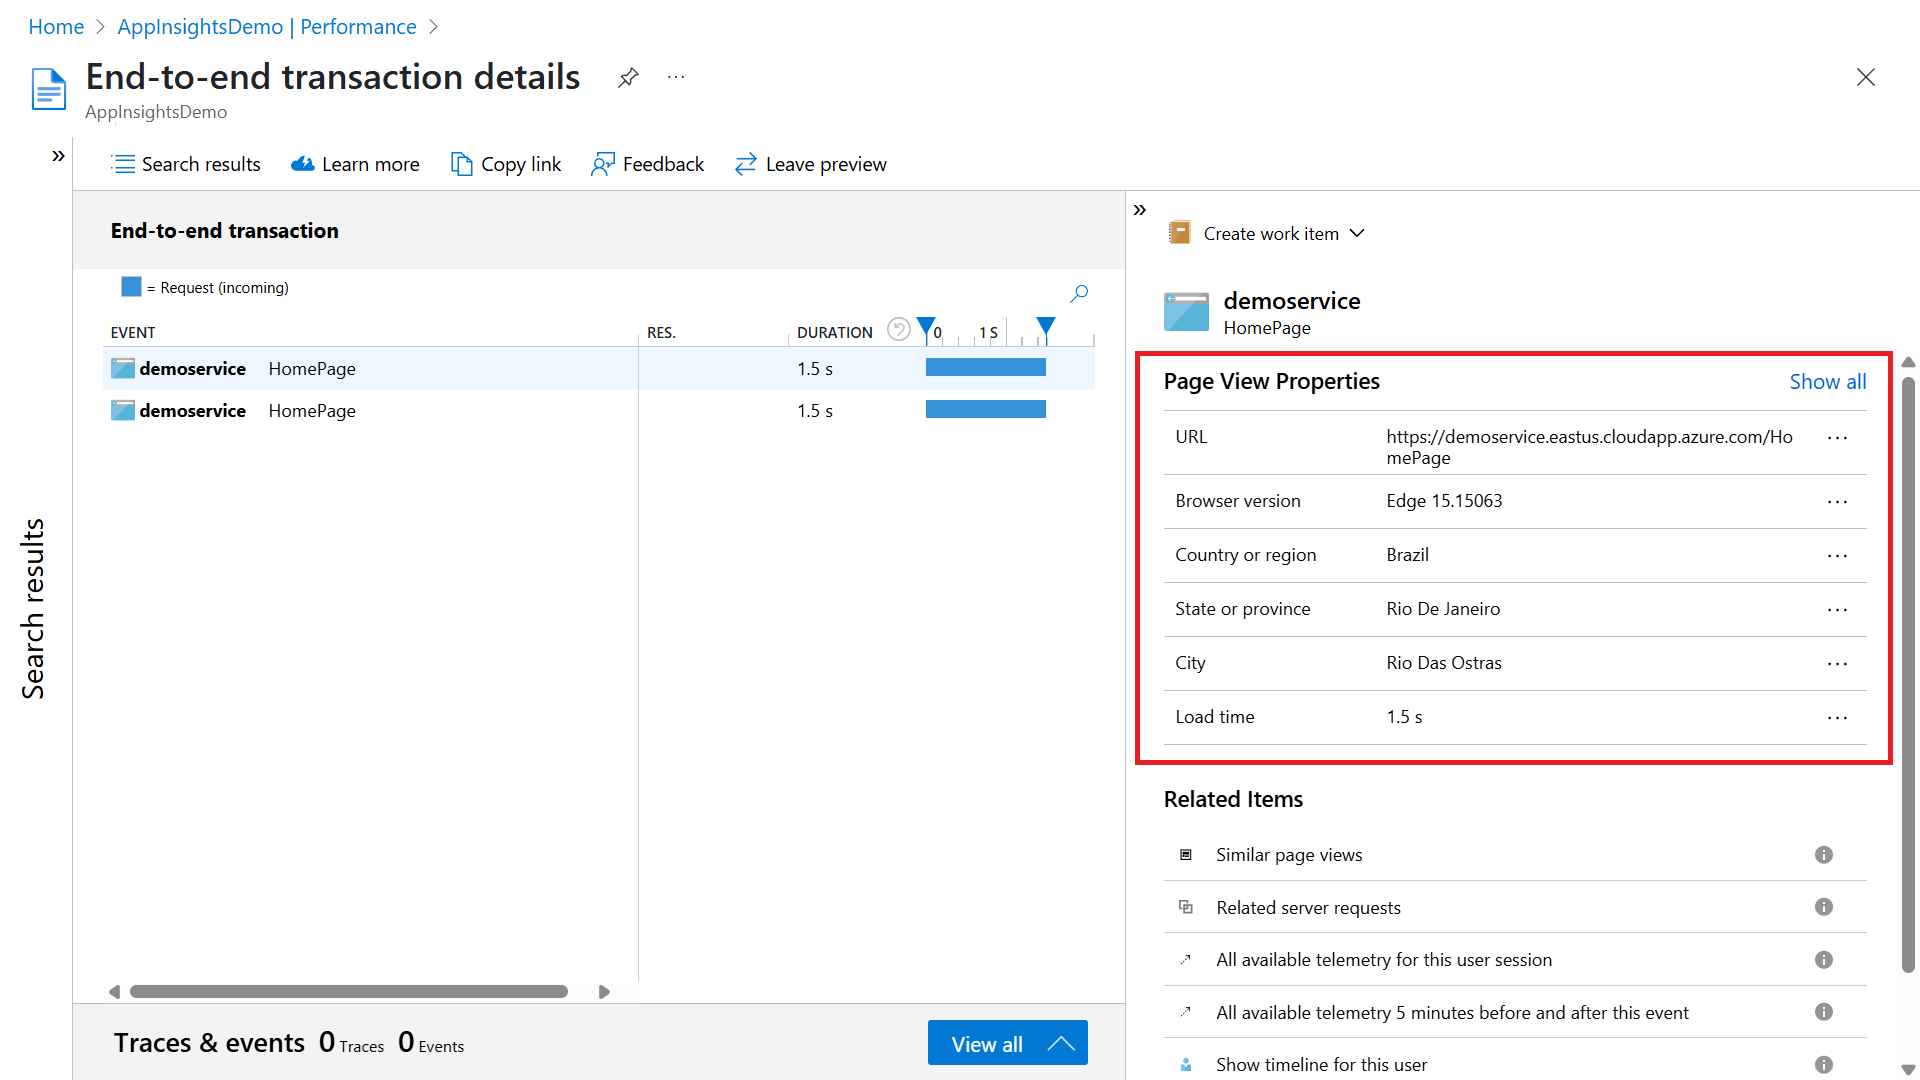
For browser operations, the end-to-end transaction details view shows Page View Properties of the client requesting the page, including the type of browser and its ___location. This information can help determining whether there are performance issues related to particular types of clients.


Note
Like the data collected for server performance, Application Insights makes all client data available for deep analysis by using logs.
Transaction diagnostics experience
The Transaction diagnostics experience, also called End-to-end transaction details view, shows a Gantt chart of the transaction, which lists all events with their duration and response code.
This diagnostics experience automatically correlates server-side telemetry from across all your Application Insights monitored components into a single view and supports multiple resources. Application Insights detects the underlying relationship and allows you to easily diagnose the application component, dependency, or exception that caused a transaction slowdown or failure.
Selecting a specific event reveals its properties, including additional information like the underlying command or call stack.
This view has four key parts:

This collapsible pane shows the other results that meet the filter criteria. Select any result to update the respective details of the preceding three sections. We try to find samples that are most likely to have the details available from all components, even if sampling is in effect in any of them. These samples are shown as suggestions.


.NET Profiler and Snapshot Debugger
.NET Profiler or Snapshot Debugger help with code-level diagnostics of performance and failure issues. With this experience, you can see .NET Profiler traces or snapshots from any component with a single selection.
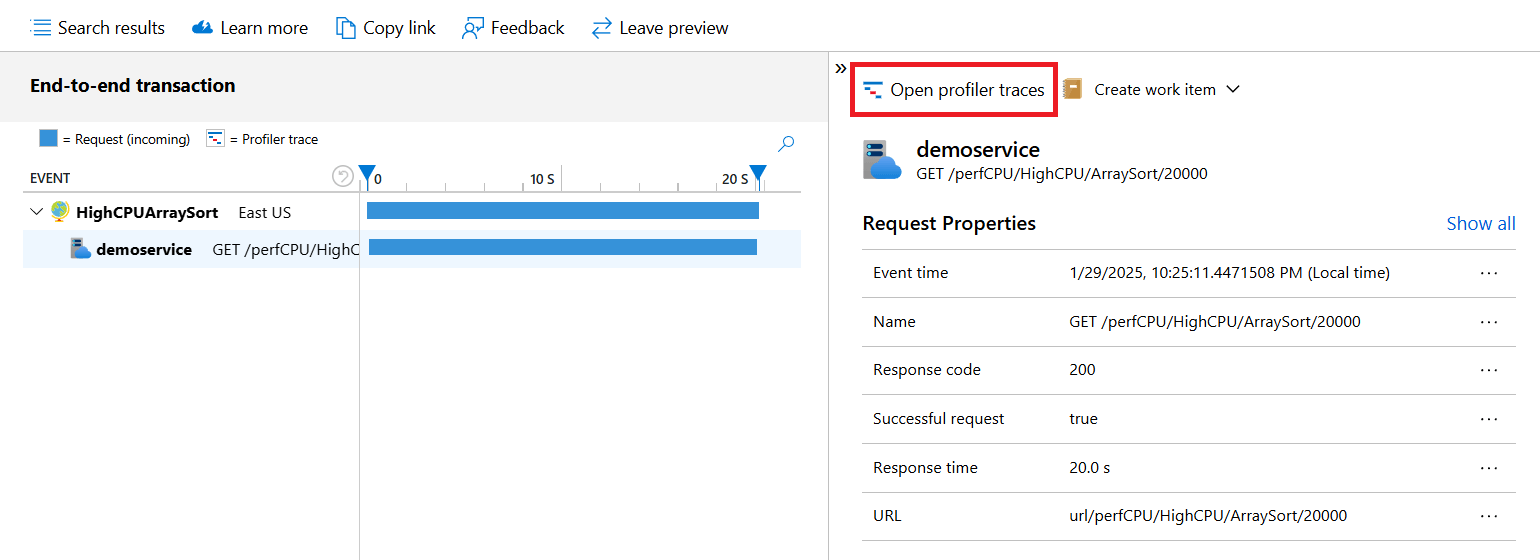
Profiler traces
The .NET Profiler helps get further with code-level diagnostics by showing the actual code that ran for the operation and the time required for each step. Some operations might not have a trace because the Profiler runs periodically. Over time, more operations should have traces.
To start .NET Profiler, select an operation on the Performance view, then go to Profiler traces.
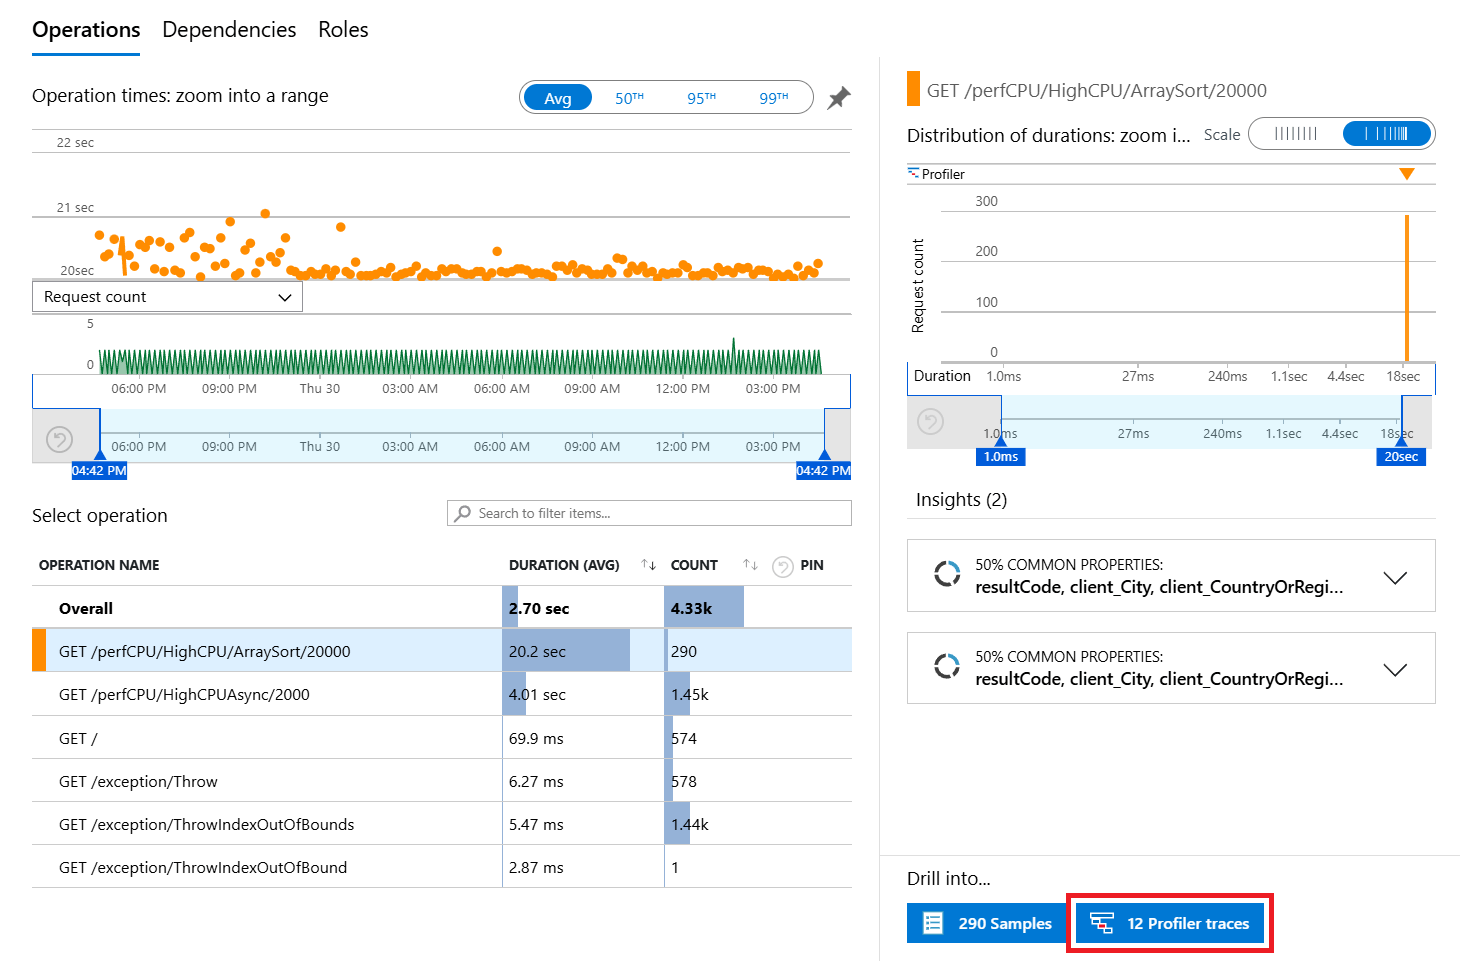
Alternatively, you can do so on the end-to-end transaction details view.
The trace shows the individual events for each operation so that you can diagnose the root cause during overall operation. Select one of the top examples that has the longest duration.
Select the link in the Performance Tip (in this example, CPU time) for documentation on interpreting the event.
For further analysis, select Download Trace to download the trace. You can view this data by using PerfView.

Note
Hot path is selected by default. It highlights the specific path of events that contribute to the issue you're investigating, indicated by the flame icon next the event name.


If you can't get the .NET Profiler working, contact serviceprofilerhelp@microsoft.com.
Debug Snapshot
To see code-level debug information of an exception:
Select the exception in the Gantt chart, then Open debug snapshot.
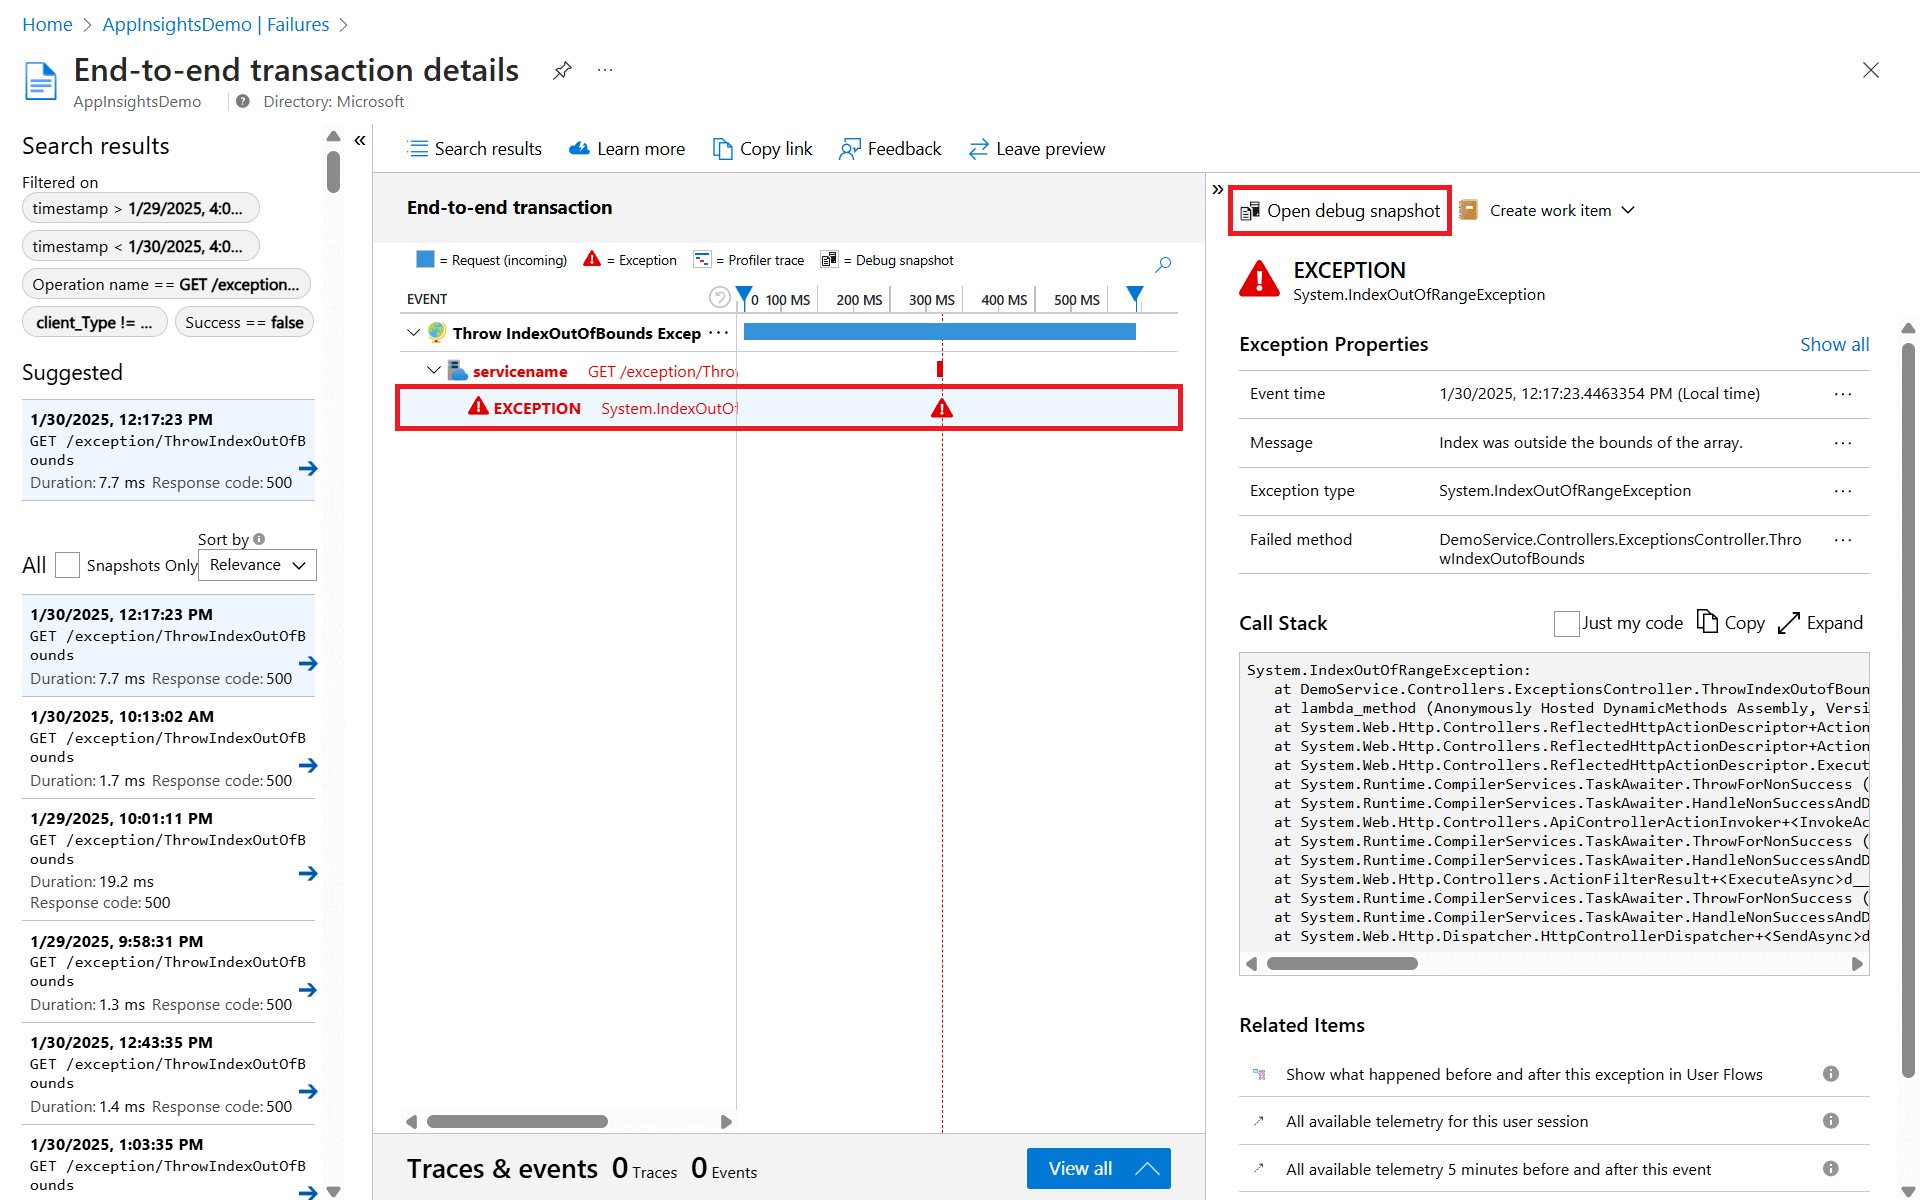
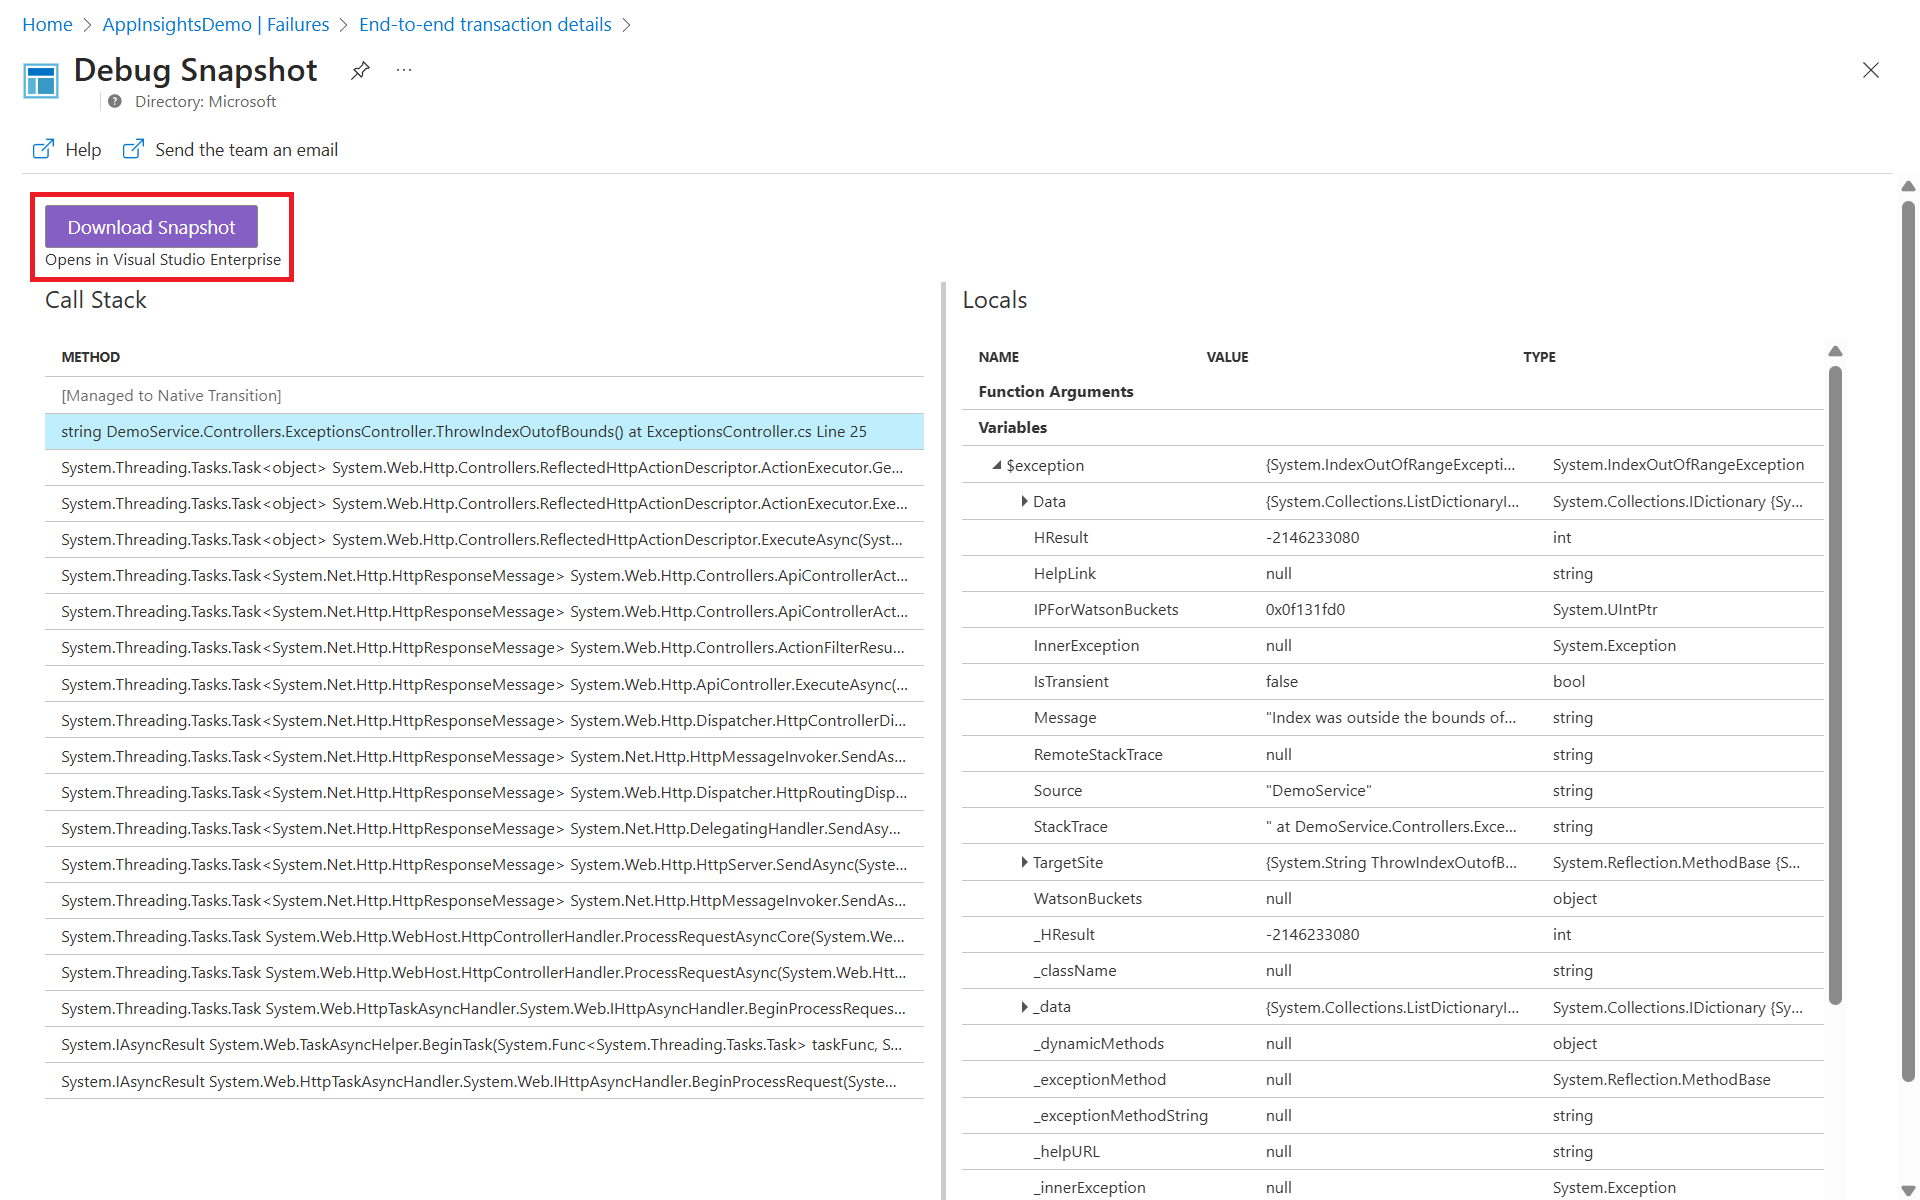
Snapshot Debugger shows the call stack and allows you to inspect variables at each call stack frame. By selecting a method, you can view the values of all local variables at the time of the request.
Afterwards, you can debug the source code by downloading the snapshot and opening it in Visual Studio.


If you can't get Snapshot Debugger working, contact snapshothelp@microsoft.com.
Create a work item
If you connect Application Insights to a tracking system such as Azure DevOps or GitHub, you can create a work item with the details from any telemetry item directly from Application Insights.
Note
The first time you do this step, you're asked to configure a link to your Azure DevOps organization and project.
Go to the End-to-end transaction details view and select an event.
In the Details section, select Create work item and create a new template or pick an existing one.
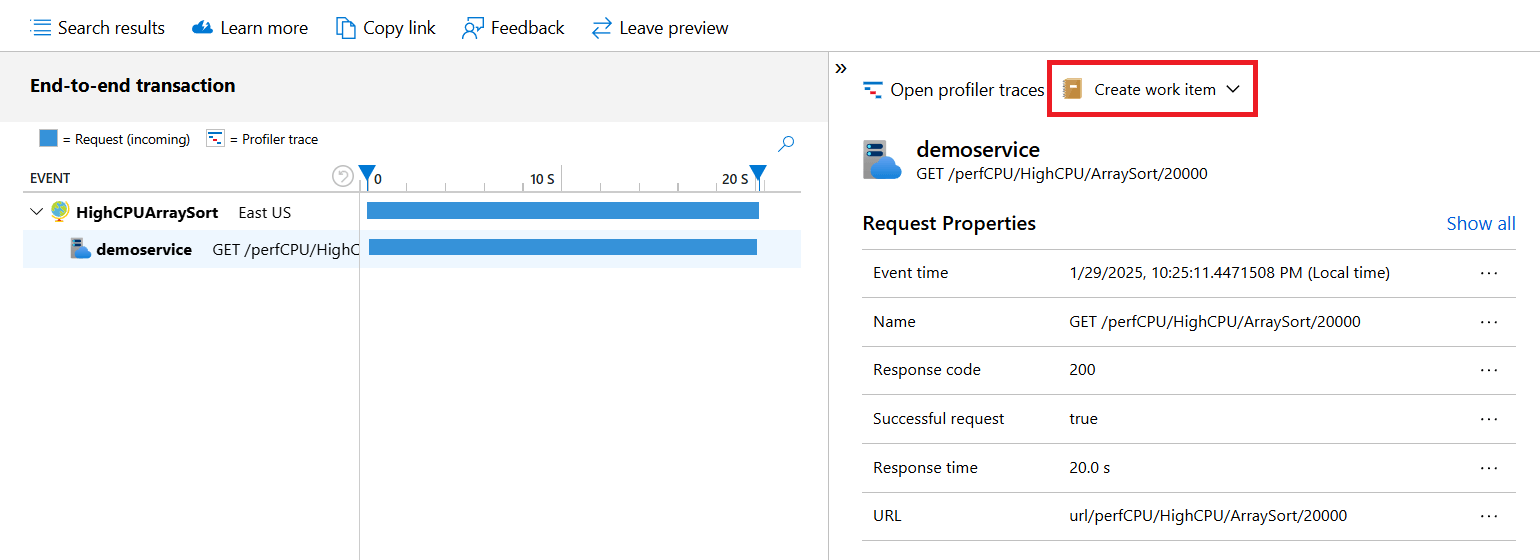
The New Work Item pane opens with details about the exception already populated. You can add more information before you save it.

Frequently asked questions
This section provides answers to common questions.
Transaction search
What is a component?
Components are independently deployable parts of your distributed or microservice application. Developers and operations teams have code-level visibility or access to telemetry generated by these application components.
- Components are different from "observed" external dependencies, such as SQL and event hubs, which your team or organization might not have access to (code or telemetry).
- Components run on any number of server, role, or container instances.
- Components can be separate Application Insights instrumentation keys, even if subscriptions are different. Components also can be different roles that report to a single Application Insights instrumentation key. The new experience shows details across all components, regardless of how they were set up.
How much data is retained?
See the Limits summary.
How can I see POST data in my server requests?
We don't log the POST data automatically, but you can use TrackTrace or log calls. Put the POST data in the message parameter. You can't filter on the message in the same way you can filter on properties, but the size limit is longer.
Why does my Azure Function search return no results?
Azure Functions doesn't log URL query strings.
Transaction diagnostics
Why do I see a single component on the chart and the other components only show as external dependencies without any details?
Potential reasons:
- Are the other components instrumented with Application Insights?
- Are they using the latest stable Application Insights SDK?
- If these components are separate Application Insights resources, validate you have access. If you do have access and the components are instrumented with the latest Application Insights SDKs, let us know via the feedback channel in the upper-right corner.
I see duplicate rows for the dependencies. Is this behavior expected?
Currently, we're showing the outbound dependency call separate from the inbound request. Typically, the two calls look identical with only the duration value being different because of the network round trip. The leading icon and distinct styling of the duration bars help differentiate between them. Is this presentation of the data confusing? Give us your feedback!
What about clock skews across different component instances?
Timelines are adjusted for clock skews in the transaction chart. You can see the exact timestamps in the details pane or by using Log Analytics.
Why is the new experience missing most of the related items queries?
This behavior is by design. All the related items, across all components, are already available on the left side in the top and bottom sections. The new experience has two related items that the left side doesn't cover: all telemetry from five minutes before and after this event and the user timeline.
Is there a way to see fewer events per transaction when I use the Application Insights JavaScript SDK?
The transaction diagnostics experience shows all telemetry in a single operation that shares an Operation ID. By default, the Application Insights SDK for JavaScript creates a new operation for each unique page view. In a single-page application (SPA), only one page view event is generated and a single Operation ID is used for all telemetry generated. As a result, many events might be correlated to the same operation.
In these scenarios, you can use Automatic Route Tracking to automatically create new operations for navigation in your SPA. You must turn on enableAutoRouteTracking so that a page view is generated every time the URL route is updated (logical page view occurs). If you want to manually refresh the Operation ID, call appInsights.properties.context.telemetryTrace.traceID = Microsoft.ApplicationInsights.Telemetry.Util.generateW3CId(). Manually triggering a PageView event also resets the Operation ID.
Why do transaction detail durations not add up to the top-request duration?
Time not explained in the Gantt chart is time that isn't covered by a tracked dependency. This issue can occur because external calls weren't instrumented, either automatically or manually. It can also occur because the time taken was in process rather than because of an external call.
If all calls were instrumented, in process is the likely root cause for the time spent. A useful tool for diagnosing the process is the .NET Profiler.
What if I see the message "Error retrieving data" while navigating Application Insights in the Azure portal?
This error indicates that the browser was unable to call into a required API or the API returned a failure response. To troubleshoot the behavior, open a browser InPrivate window and disable any browser extensions that are running, then identify if you can still reproduce the portal behavior. If the portal error still occurs, try testing with other browsers, or other machines, investigate DNS or other network related issues from the client machine where the API calls are failing. If the portal error continues and needs to be investigated further, collect a browser network trace while reproducing the unexpected portal behavior, then open a support case from the Azure portal.
Next steps
- Learn more about using Application Map to spot performance bottlenecks and failure hotspots across all components of your application.
- Learn more about using the Availability view to set up recurring tests to monitor availability and responsiveness for your application.
- Learn how to write complex queries in Analytics to gain deeper insights from your telemetry data.
- Learn how to send logs and custom telemetry to Application Insights for more comprehensive monitoring.
- For an introduction to monitoring uptime and responsiveness, see the Availability overview.