Note
Access to this page requires authorization. You can try signing in or changing directories.
Access to this page requires authorization. You can try changing directories.
CPU pressure is a more accurate indicator of resource contention than traditional CPU utilization metrics. While high CPU usage shows resource consumption, it doesn't necessarily indicate performance problems. In an Azure Kubernetes Service (AKS) cluster, understanding CPU pressure through Pressure Stall Information (PSI) metrics helps identify true resource contention issues.
When a node in an AKS cluster experiences CPU pressure, applications might suffer from poor performance even when CPU utilization appears moderate. PSI metrics provide insight into actual resource contention by measuring task delays rather than just resource consumption.
This article helps you monitor CPU pressure using PSI metrics and provides best practices to resolve resource contention issues.
Symptoms
The following table outlines the common symptoms of CPU pressure:
| Symptom | Description |
|---|---|
| Increased application latency | Services respond slower even when CPU utilization appears moderate. |
| Throttled containers | Containers experience delays in processing despite having CPU resources available on the node. |
| Degraded performance | Applications experience unpredictable performance variations that don't correlate with CPU usage percentages. |
Troubleshooting checklist
To identify and resolve CPU pressure issues, follow these steps:
Step 1: Enable and monitor PSI metrics
Use one of the following methods to access PSI metrics:
- In a web browser, use Azure Monitoring Managed Prometheus or other monitoring solution to query PSI metrics.
- In a console, use the Kubernetes command-line tool (
kubectl).
Azure Monitoring Managed Prometheus provides a way to monitor PSI metrics:
Enable Azure Monitoring Managed Prometheus for your AKS cluster by following the instructions in Enable Prometheus and Grafana.
To enable customized scrape metrics for Prometheus, see Scrape configs. We recommend setting
minumum ingestion profiletofalseandnode-exportertotrue.Navigate to the Azure Monitor workspace associated with the AKS cluster from the Azure portal.

Under Monitoring, select Metrics.
Select Prometheus metrics as the data source.
Note
To use the metrics, you need to enable them in Azure Monitoring Managed Prometheus. These metrics are exposed by Node Exporter or cAdvisor.
Query specific PSI metrics in Prometheus explorer:
For node-level CPU pressure, use the
node_pressure_cpu_waiting_seconds_totalPrometheus Query Language (PromQL).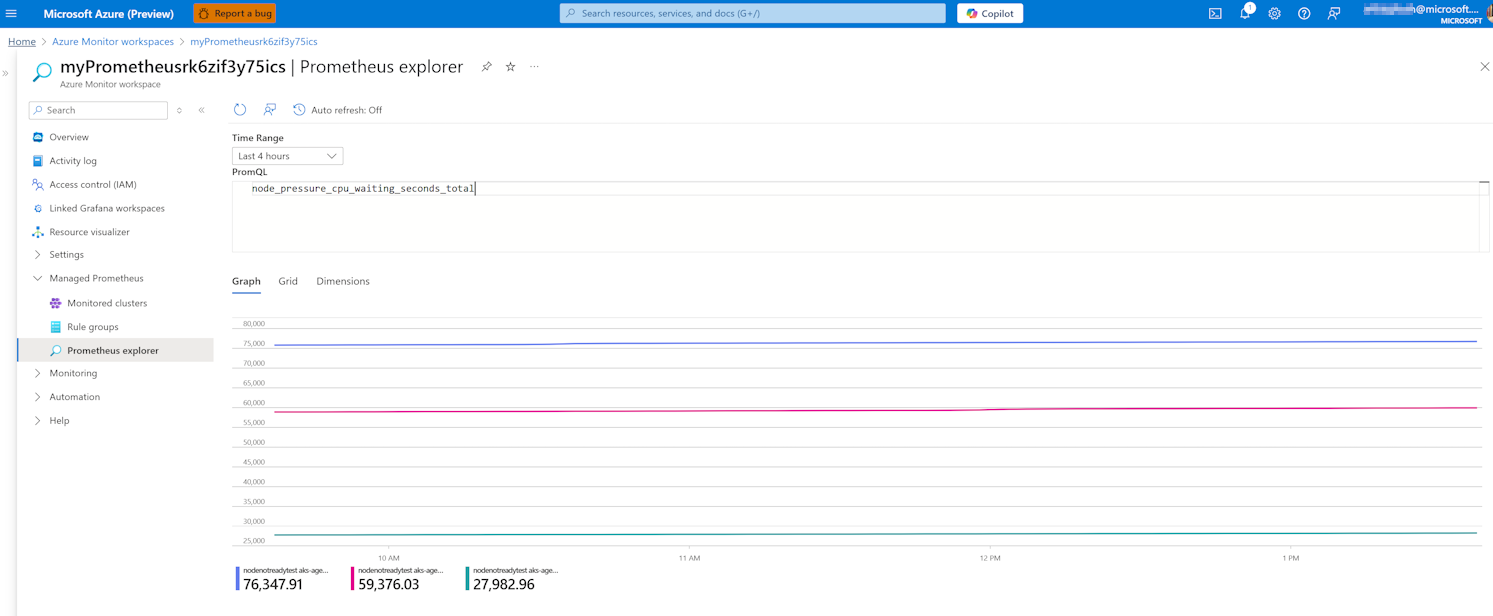
For pod-level CPU pressure, use the
container_cpu_cfs_throttled_seconds_totalPromQL.
Calculate the PSI-some percentage (percentage of time at least one task is stalled on CPU):
rate(node_pressure_cpu_waiting_seconds_total[5m]) * 100


Note
Some of the container level metrics such as container_pressure_cpu_waiting_seconds_total and container_pressure_cpu_stalled_seconds_total aren't available in AKS as they're part of the Kubelet PSI feature gate that is in alpha state. AKS begins supporting the use of the feature when it reaches beta stage.
Step 2: Review best practices to prevent CPU pressure
Review the following table to learn how to implement best practices for avoiding CPU pressure:
| Best practice | Description |
|---|---|
| Focus on PSI metrics instead of utilization | Use PSI metrics as your primary indicator of resource contention rather than CPU utilization percentages. For more information, see PSI - Pressure Stall Information. |
| Identify pods utilizing the most CPU | Isolate the pods that are utilizing the most CPU and identify solutions to reduce pressure. For more information, see Troubleshoot high CPU usage in AKS clusters. |
| Minimize CPU limits | Consider removing CPU limits and rely on Linux's Completely Fair Scheduler with CPU shares based on requests. For more information, see Resource Management for Pods and Containers. |
| Use appropriate Quality of Service (QoS) classes | Set the right QoSclass for each pod based on its importance and contention sensitivity. For more information, see Configure Quality of Service for Pods. |
| Optimize pod placement | Use pod anti-affinity rules to avoid placing CPU-intensive workloads on the same nodes. For more information, see Assigning Pods to Nodes. |
| Monitor for brief pressure spikes | Short pressure spikes can indicate issues even when average utilization appears acceptable. For more information, see Resource metrics pipeline. |
Key PSI metrics to monitor
Note
If a node's CPU usage is moderate but the containers on the node experience CFS throttling, increase the resource limits, or remove them and follow Linux's Completely Fair Scheduler (CFS) algorithm.
Node-level PSI metrics
node_pressure_cpu_waiting_seconds_total: Cumulative time tasks wait for CPU.node_cpu_seconds_total: Traditional CPU utilization for comparison.
Container-level PSI indicators
container_cpu_cfs_throttled_periods_total: The number of periods a container is throttled.container_cpu_cfs_throttled_seconds_total: Total time a container is throttled.- Throttling percentage:
rate(container_cpu_cfs_throttled_periods_total[5m]) / rate(container_cpu_cfs_periods_total[5m]) * 100
Why using PSI metrics?
AKS uses PSI metrics as an indicator for CPU pressure instead of load average for several reasons:
- In oversized and multi-core nodes, load average often underreports CPU saturation.
- On chattier and containerized nodes, load average can over-signal, leading to alert fatigue.
- Since load average doesn't have per-cgroup visibility, noisy pods can hide behind a low system average.
References
- Linux PSI documentation
- Kubernetes resource management
- AKS performance best practices
- Enable Prometheus and Grafana
- Quality of Service in Kubernetes
- Linux Completely Fair Scheduler
Contact us for help
If you have questions or need help, create a support request, or ask Azure community support. You can also submit product feedback to Azure feedback community.