Note
Access to this page requires authorization. You can try signing in or changing directories.
Access to this page requires authorization. You can try changing directories.
Using language models incurs costs. To understand how your application uses large language models, use Dev Proxy to intercept OpenAI-compatible requests and responses. Dev Proxy analyzes the requests and responses and logs telemetry data to help you understand how your application uses large language models. This information allows you to optimize your application and reduce costs.
Dev Proxy logs language model usage data in OpenTelemetry format. You can use any OpenTelemetry-compatible dashboard to visualize the data. For example, you can use the .NET Aspire dashboard or OpenLIT. The telemetry data includes the number of tokens used in the request and response, the cost of the tokens used, and the total cost of all requests over the course of a session.
Intercept OpenAI-compatible requests and responses using Dev Proxy
To intercept OpenAI-compatible requests and responses, use the OpenAITelemetryPlugin. This plugin logs telemetry data from the OpenAI-compatible requests and responses that it intercepts and emits OpenTelemetry data.
Create a Dev Proxy configuration file
Create a new Dev Proxy configuration file using the
devproxy config newcommand or using the Dev Proxy Toolkit extension.Add the
OpenAITelemetryPluginto the configuration file.{ "$schema": "https://raw.githubusercontent.com/dotnet/dev-proxy/main/schemas/v0.28.0/rc.schema.json", "plugins": [ { "name": "OpenAITelemetryPlugin", "enabled": true, "pluginPath": "~appFolder/plugins/dev-proxy-plugins.dll" } ], "urlsToWatch": [ ], "logLevel": "information", "newVersionNotification": "stable", "showSkipMessages": true }Configure the
urlsToWatchproperty to include the URLs of the OpenAI-compatible requests that you want to intercept. The following example intercepts requests to Azure OpenAI chat completions.{ "$schema": "https://raw.githubusercontent.com/dotnet/dev-proxy/main/schemas/v0.28.0/rc.schema.json", "plugins": [ { "name": "OpenAITelemetryPlugin", "enabled": true, "pluginPath": "~appFolder/plugins/dev-proxy-plugins.dll" } ], "urlsToWatch": [ "https://*.openai.azure.com/openai/deployments/*/chat/completions*", "https://*.cognitiveservices.azure.com/openai/deployments/*/chat/completions*" ], "logLevel": "information", "newVersionNotification": "stable", "showSkipMessages": true }Save your changes.
Start OpenTelemetry collector and Dev Proxy
Important
Both .NET Aspire and OpenLIT require Docker to run. If you don't have Docker installed, follow the instructions in the Docker documentation to install Docker.
Start Docker.
Start the OpenTelemetry collector.
Run the following command to start the .NET Aspire OpenTelemetry collector and dashboard:
docker run --rm -it -p 18888:18888 -p 4317:18889 -p 4318:18890 --name aspire-dashboard mcr.microsoft.com/dotnet/aspire-dashboard:latestNote
When you're finished using the .NET Aspire dashboard, stop the dashboard by pressing Ctrl + C in the terminal where you started the dashboard. Docker automatically removes the container when you stop it.
Open the .NET Aspire dashboard in your browser at
http://localhost:18888/login?t=<code>.
To start Dev Proxy, change the working directory to the folder where you created the Dev Proxy configuration file and run the following command:
devproxy
Use language model and inspect telemetry data
Make a request to the OpenAI-compatible endpoint that you configured Dev Proxy to intercept.
Verify that Dev Proxy intercepted the request and response. In the console, where Dev Proxy is running, you should see similar information:
 info    Dev Proxy API listening on http://127.0.0.1:8897...
 info    Dev Proxy listening on 127.0.0.1:8000...

Hotkeys: issue (w)eb request, (r)ecord, (s)top recording, (c)lear screen
Press CTRL+C to stop Dev Proxy


 req   ╭ POST https://some-resource.cognitiveservices.azure.com/openai/deployments/some-deployment/chat/completions?api-version=2025-01-01-preview
 time  │ 19/05/2025 07:53:38 +00:00
 pass  │ Passed through
 proc  ╰ OpenAITelemetryPlugin: OpenTelemetry information emitted
In the web browser, navigate to the OpenTelemetry dashboard.
From the side menu, select Traces.
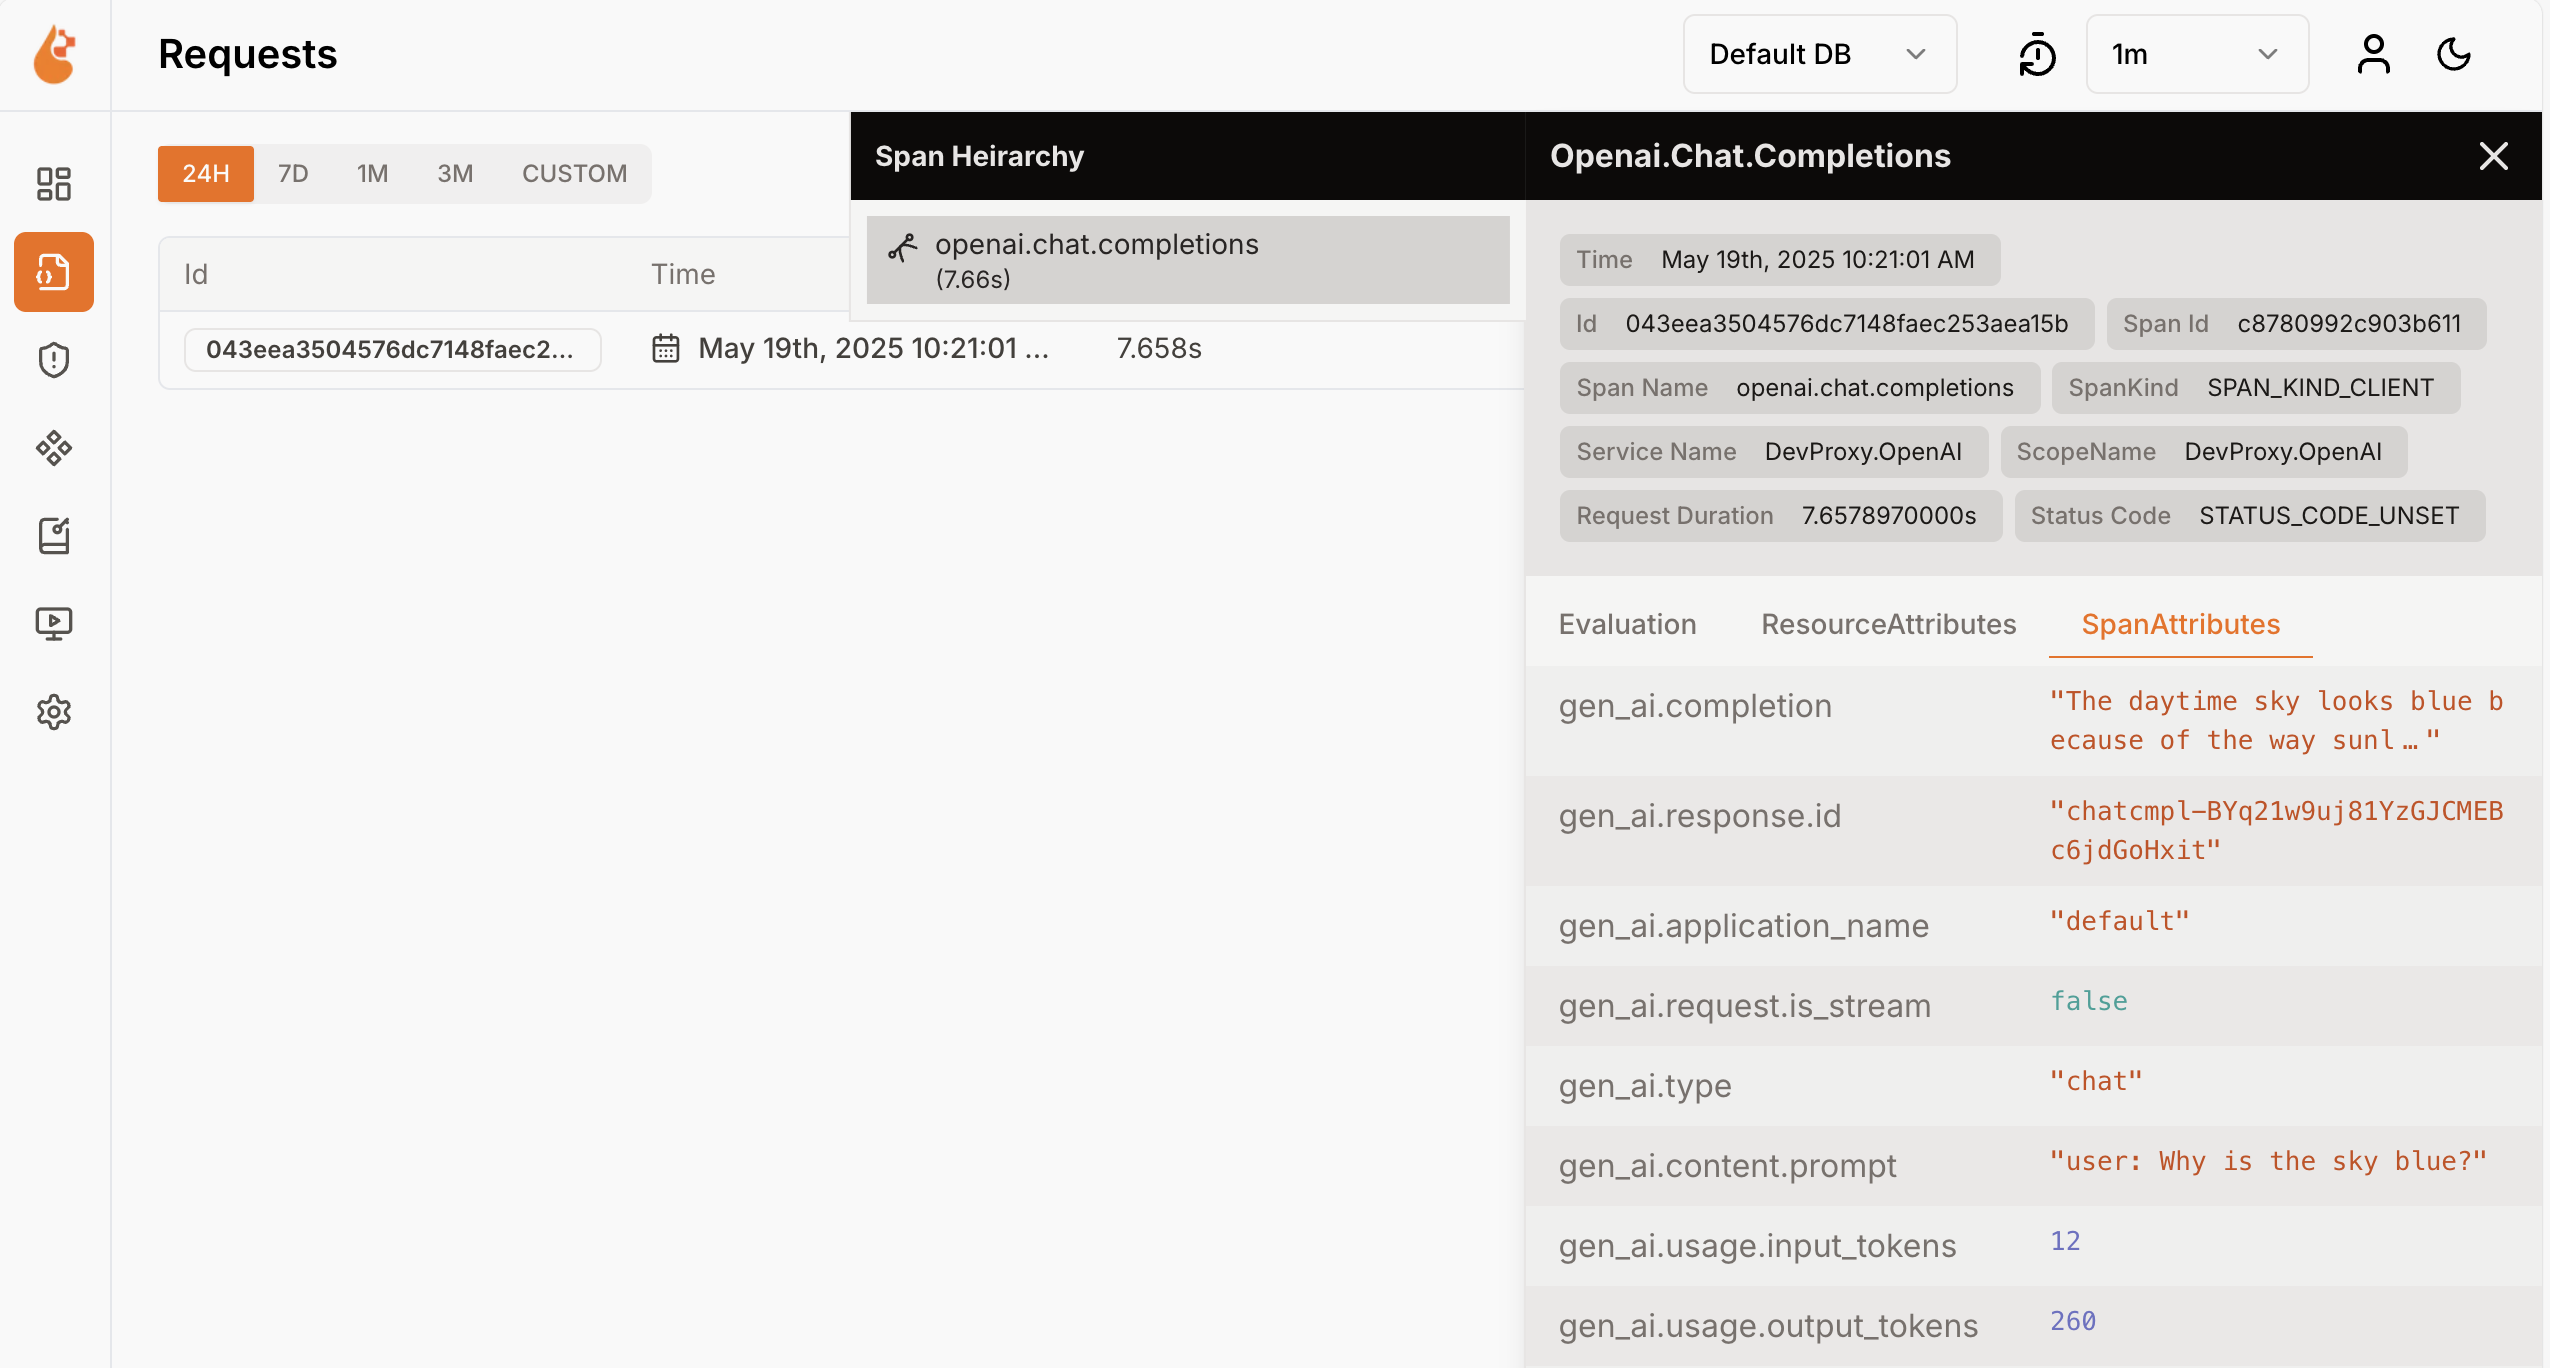
Select one of the traces named
DevProxy.OpenAI.Select the request span.
In the side panel, explore the language model usage data.
In the side panel, switch to Metrics.
From the Resource drop-down list, select DevProxy.OpenAI.
From the list of metrics, select gen_ai.client.token.usage to see a chart showing the number of tokens that your application uses.
Stop Dev Proxy by pressing Ctrl + C in the terminal where it's running.
Understand language model costs
Dev Proxy supports estimating the costs of using language models. To allow Dev Proxy to estimate costs, you need to provide information about prices for the models you use.
Create a prices file
In the same folder where you created the Dev Proxy configuration file, create a new file named
prices.json.Add the following content to the file:
{
  "$schema": "https://raw.githubusercontent.com/dotnet/dev-proxy/main/schemas/v0.28.0/openaitelemetryplugin.pricesfile.schema.json",
  "prices": {
    "o4-mini": {
      "input": 0.97,
      "output": 3.87
    }
  }
}
Important
The key is the name of the language model. The
inputandoutputproperties are the prices per million tokens for input and output tokens. If you use a model for which there's no price information, Dev Proxy doesn't log the cost metrics.Save your changes.
In the code editor, open the Dev Proxy configuration file.
Extend the
OpenAITelemetryPluginreference with a configuration section:{ "$schema": "https://raw.githubusercontent.com/dotnet/dev-proxy/main/schemas/v0.28.0/rc.schema.json", "plugins": [ { "name": "OpenAITelemetryPlugin", "enabled": true, "pluginPath": "~appFolder/plugins/dev-proxy-plugins.dll", "configSection": "openAITelemetryPlugin" } ], "urlsToWatch": [ "https://*.openai.azure.com/openai/deployments/*/chat/completions*", "https://*.cognitiveservices.azure.com/openai/deployments/*/chat/completions*" ], "logLevel": "information", "newVersionNotification": "stable", "showSkipMessages": true }Add the
openAITelemetryPluginsection to the configuration file:{ "$schema": "https://raw.githubusercontent.com/dotnet/dev-proxy/main/schemas/v0.28.0/rc.schema.json", "plugins": [ { "name": "OpenAITelemetryPlugin", "enabled": true, "pluginPath": "~appFolder/plugins/dev-proxy-plugins.dll", "configSection": "openAITelemetryPlugin" } ], "urlsToWatch": [ "https://*.openai.azure.com/openai/deployments/*/chat/completions*", "https://*.cognitiveservices.azure.com/openai/deployments/*/chat/completions*" ], "openAITelemetryPlugin": { "$schema": "https://raw.githubusercontent.com/dotnet/dev-proxy/main/schemas/v0.28.0/openaitelemetryplugin.schema.json", "includeCosts": true, "pricesFile": "prices.json" }, "logLevel": "information", "newVersionNotification": "stable", "showSkipMessages": true }Notice the
includeCostsproperty set totrueand thepricesFileproperty set to the name of the file with prices information.Save your changes.
View estimated costs
Start Dev Proxy.
Make a request to the OpenAI-compatible endpoint that you configured Dev Proxy to intercept.
In the web browser, navigate to the OpenTelemetry dashboard.
Stop Dev Proxy by pressing Ctrl + C in the terminal where it's running.
Stop the OpenTelemetry collector.
In the terminal where the .NET Aspire dashboard is running, press Ctrl + C to stop the dashboard. Docker automatically removes the container when you stop it.
Next steps
Learn more about the OpenAITelemetryPlugin.


