Note
Access to this page requires authorization. You can try signing in or changing directories.
Access to this page requires authorization. You can try changing directories.
This quickstart helps you integrate your GenAI app with MLflow Tracing if you use a Databricks Notebook as your development environment. If you use a local IDE, please use the IDE quickstart instead.
What you'll achieve
By the end of this tutorial, you will have:
- A Databricks Notebook with a linked MLflow Experiment for your GenAI app
- A simple GenAI application instrumented with MLflow Tracing
- A trace from that app in your MLflow Experiment

Prerequisites
- Databricks Workspace: Access to a Databricks workspace.
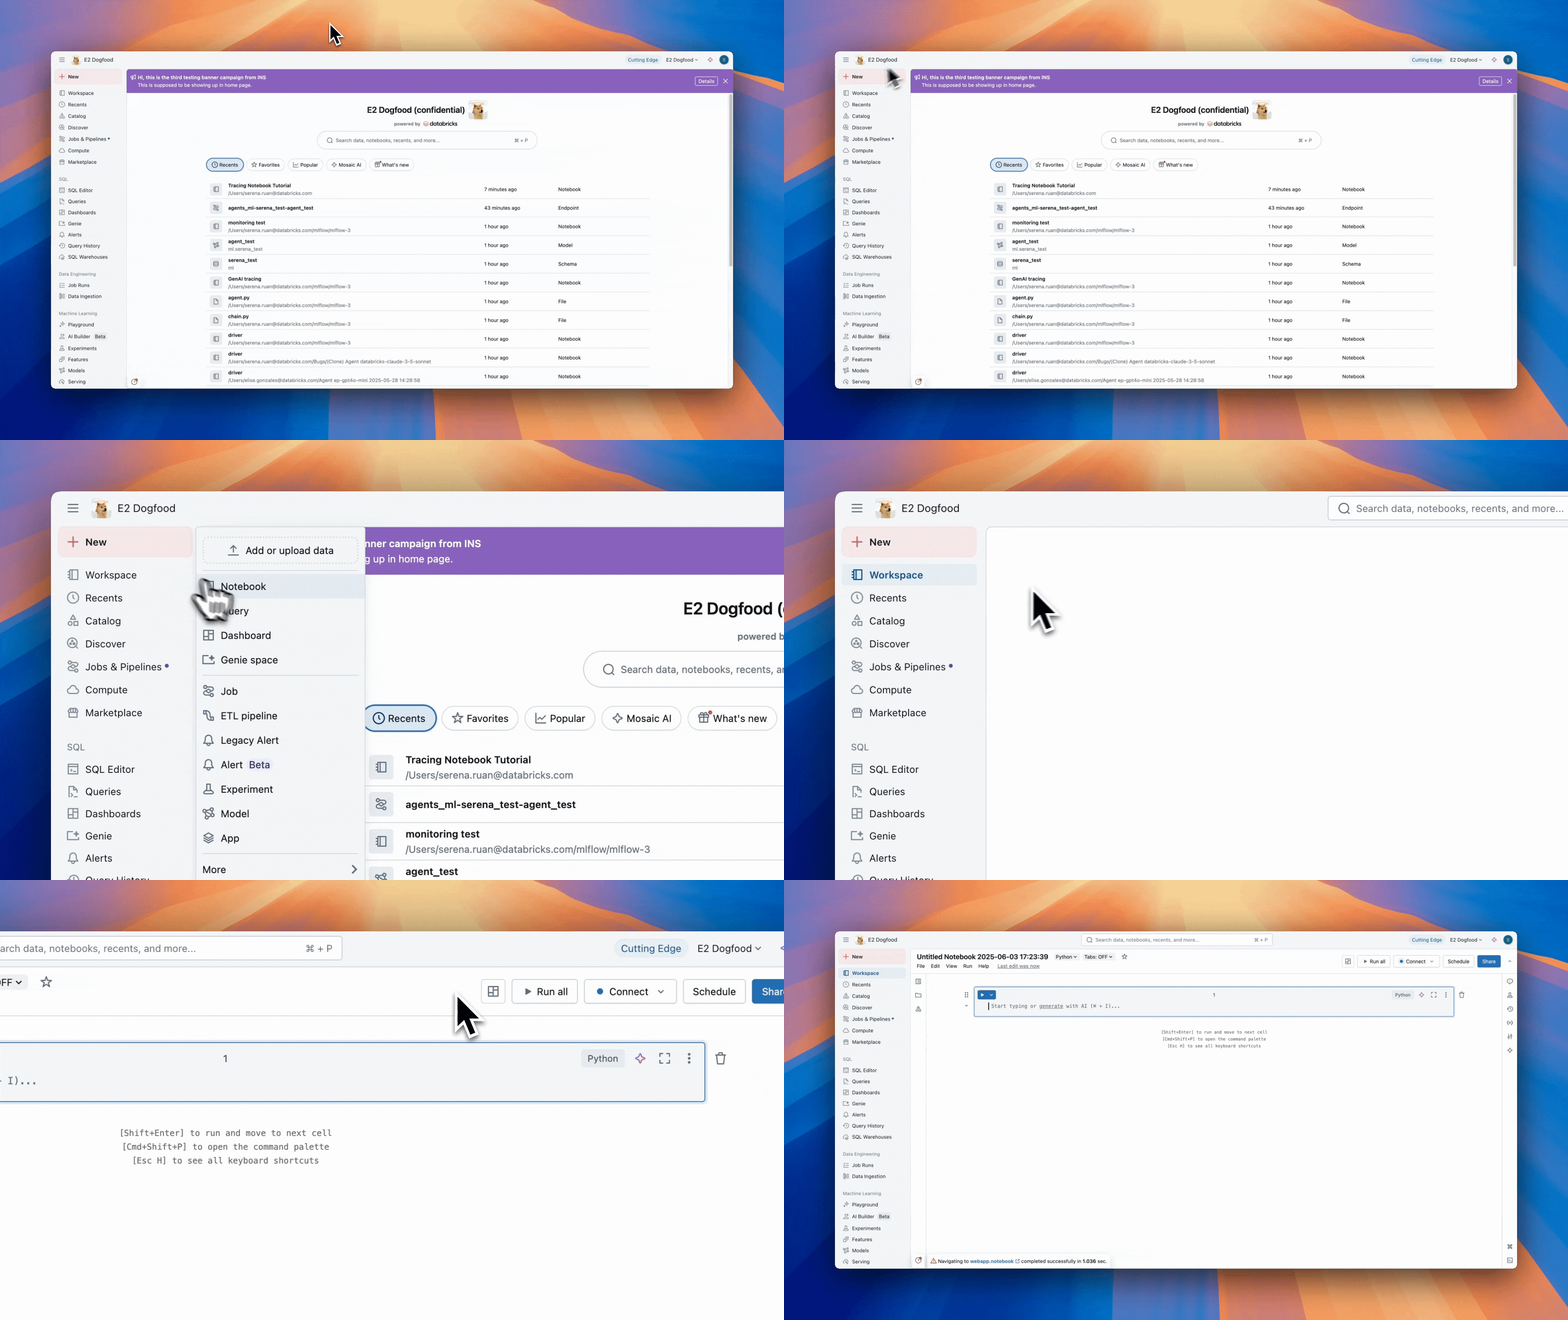
Step 1: Create a Databricks Notebook
Note
Creating a Databricks Notebook will create an MLflow Experiment that is the container for your GenAI application. Learn more about the Experiment and what it contains in the data model section.
- Open your Databricks workspace
- Go to New at the top of the left sidebar
- Click Notebook

Step 2: (Recommended) Ensure you have the latest version of MLflow
Databricks runtimes include MLflow. However, for the best experience with GenAI capabilities, including the most comprehensive tracing features and robust support, it is highly recommended to use the latest version of MLflow.
You can update MLflow in your notebook by running:
%pip install --upgrade "mlflow[databricks]>=3.1" openai
dbutils.library.restartPython()
mlflow[databricks]>=3.1: This command ensures you have MLflow 3.1 or a more recent version, along with thedatabricksextra for seamless connectivity and functionality within Databricks.dbutils.library.restartPython(): This is crucial to ensure the newly installed version is used by the Python kernel.
Warning
While tracing features are available in MLflow 2.15.0+, it is strongly recommended to install MLflow 3 (specifically 3.1 or newer if using mlflow[databricks]) for the latest GenAI capabilities, including expanded tracing features and robust support.
Step 3: Instrument your application
Tip
Databricks provided out of the box access to popular frontier and open source foundational LLMs. To run this quickstart, you can:
- Use the Databricks hosted LLMs
- Directly use your own API key from an LLM provider
- Create an external model to enable governed access to your LLM provider's API keys
If you prefer to use one of the other 20+ LLM SDKs (Anthropic, Bedrock, etc) or GenAI authoring frameworks (LangGraph, etc) that MLflow supports, follow the instructions that appear when you create a new MLflow Experiment.
Select the appropriate integration for your application:
Create a cell in your notebook with the below code
Here, we use the
@mlflow.tracedecorator that makes it easy to trace any Python application combined with the OpenAI automatic instrumentation to captures the details of the call to the OpenAI SDK.The code snippet below uses Anthropic's Claude Sonnet LLM. You can select another LLM from the list of supported foundational models.
import mlflow
from databricks.sdk import WorkspaceClient

# Enable MLflow's autologging to instrument your application with Tracing
mlflow.openai.autolog()

# Create an OpenAI client that is connected to Databricks hosted LLMs
mlflow_creds = mlflow.utils.databricks_utils.get_databricks_host_creds()
client = OpenAI(
    api_key=mlflow_creds.token,
    base_url=f"{mlflow_creds.host}/serving-endpoints"
)

# Use the trace decorator to capture the application's entry point
@mlflow.trace
def my_app(input: str):
  # This call is automatically instrumented by `mlflow.openai.autolog()`
  response = client.chat.completions.create(
    model="databricks-claude-sonnet-4",  # This example uses a Databricks hosted LLM - you can replace this with any AI Gateway or Model Serving endpoint. If you have an external model endpoint configured, you can use that model name here.
    messages=[
      {
        "role": "system",
        "content": "You are a helpful assistant.",
      },
      {
        "role": "user",
        "content": input,
      },
    ],
  )
  return response.choices[0].message.content

result = my_app(input="What is MLflow?")
print(result)
Run the Notebook cell to execute the code
Step 4: View the Trace in MLflow
- The Trace will appear below the Notebook cell
- Optionally, you can go to the MLflow Experiment UI to see the Trace
- Click on the Experiment icon on the right side of your screen
- Click the open icon next to Experiment Runs
- You will now see the generated trace in the Traces tab
- Click on the trace to view its details
Understanding the Trace
The trace you've just created shows:
- Root Span: Represents the inputs to the
my_app(...)function- Child Span: Represents the OpenAI completion request
- Attributes: Contains metadata like model name, token counts, and timing information
- Inputs: The messages sent to the model
- Outputs: The response received from the model
This simple trace already provides valuable insights into your application's behavior, such as:
- What was asked
- What response was generated
- How long the request took
- How many tokens were used (affecting cost)
Tip
For more complex applications like RAG systems or multi-step agents, MLflow Tracing provides even more value by revealing the inner workings of each component and step.
Next steps
Continue your journey with these recommended actions and tutorials.
- Evaluate your app's quality - Measure and improve your GenAI app's quality with MLflow's evaluation capabilities
- Collect human feedback - Learn how to collect feedback from users and ___domain experts
- Track users & sessions - Add user and conversation context to your traces
Reference guides
Explore detailed documentation for concepts and features mentioned in this guide.
- Tracing concepts - Understand the fundamentals of MLflow Tracing
- Tracing data model - Learn about traces, spans, and how MLflow structures observability data
- Manual tracing APIs - Explore advanced tracing techniques for custom instrumentation