Note
Access to this page requires authorization. You can try signing in or changing directories.
Access to this page requires authorization. You can try changing directories.
In announcing Visual Studio Beta 2 profiler features, Chris mentioned that we have a new option on the Debug menu called ‘Start Performance Analysis’ which has the Alt-F2 keyboard shortcut. This makes it easier than ever to start profiling your application. The new menu item has the following behavior:
- You must have a Visual Studio Solution open in order to enable it.
- If you have a solution open, but do not have a launchable current performance session, Start Performance Analysis launches the Performance Wizard.
- If you have a solution open and have a launchable current performance session, Start Performance Analysis starts profiling.
Let’s use this new functionality to profile an application that I have prepared earlier.
- Open the solution with ‘Alt-F, J, Enter’:

- Start Performance Analysis with ‘Alt-F2’, which brings up the wizard:
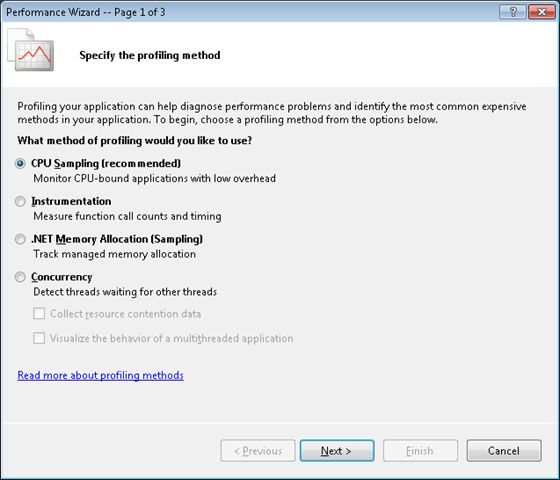
- Press ‘Enter’ to choose the default ‘CPU Sampling’ profiling method and move to the target selection page:
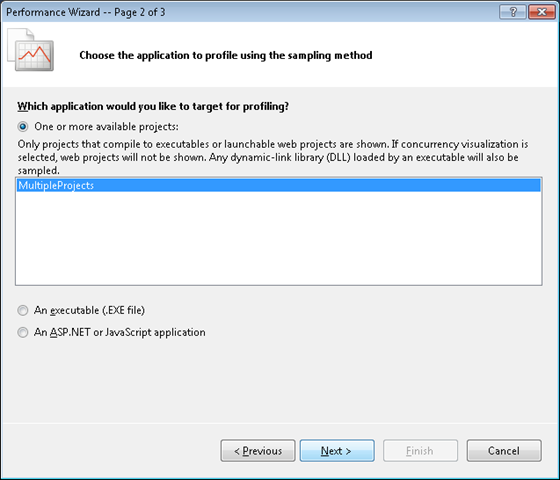
- Press ‘Enter’ to select the only launchable project in the solution and move to final wizard page:
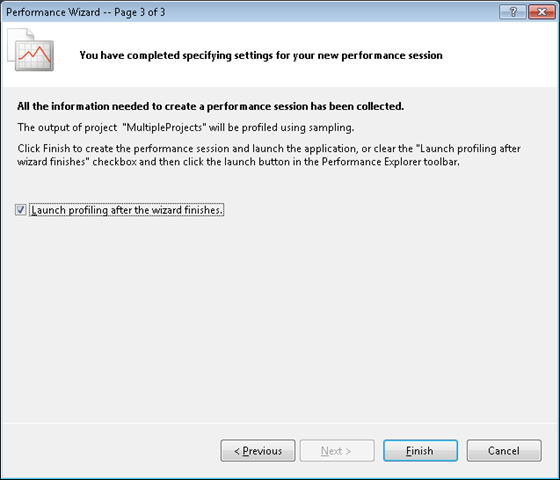
- Press ‘Enter’ to finish the wizard and start profiling:
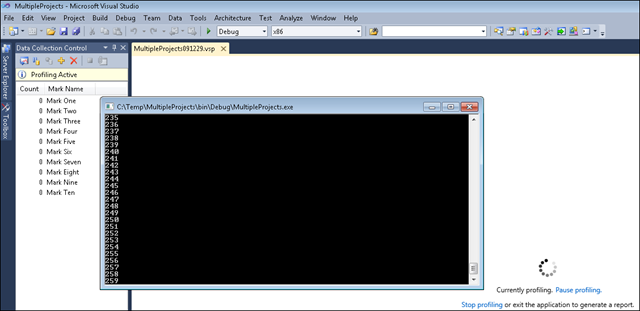
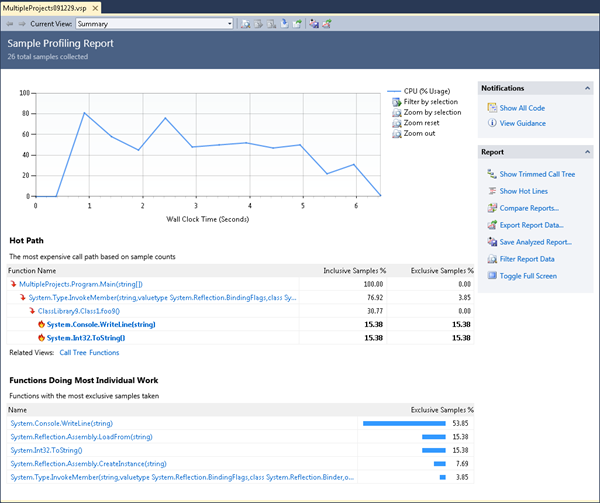
- The report will open when profiling finishes:
If you wish to profile again, selecting Alt-F2 will start profiling with the Performance Session that was created after step #4.