Note
Access to this page requires authorization. You can try signing in or changing directories.
Access to this page requires authorization. You can try changing directories.
I've covered the Visual Studio 2010 Historical Debugger extensively in a few of the previous posts. In this post, I'll cover how the Historical Debugger makes debugging LINQ to SQL queries a lot more convenient.
If you are trying to debug a LINQ to SQL query, often it helps to look at the generated T-SQL code to get an understanding of what the query is trying to do. In the following example, I have a very simple query expression that returns a list of customers, ordered by their CustomerID.
 Dim q =
    From c In db.Customers _
    Order By c.CustomerID _
    Select c
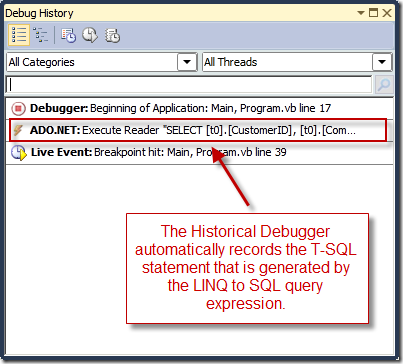
Using the Historical Debugger, it's super easy to see what the underlying T-SQL query looks like. That's because the Historical Debugger records queries made to the database, as seen below.

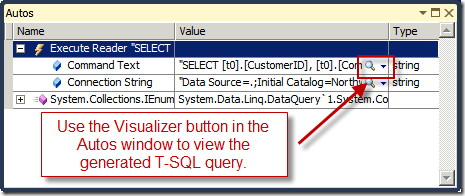
To see the generated T-SQL query, you can use the Autos window, as shown below.

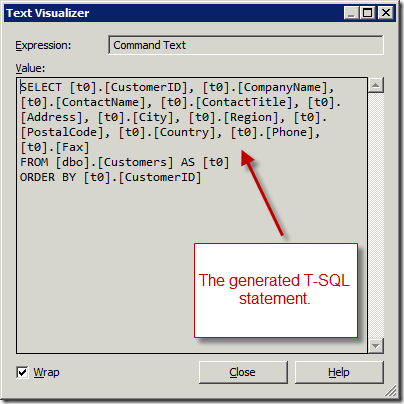
Once you click the Visualizer button in the Autos window, you can see the entire T-SQL statement that is generated by the LINQ to SQL query expression.

Habib Heydarian.