Creating Reports
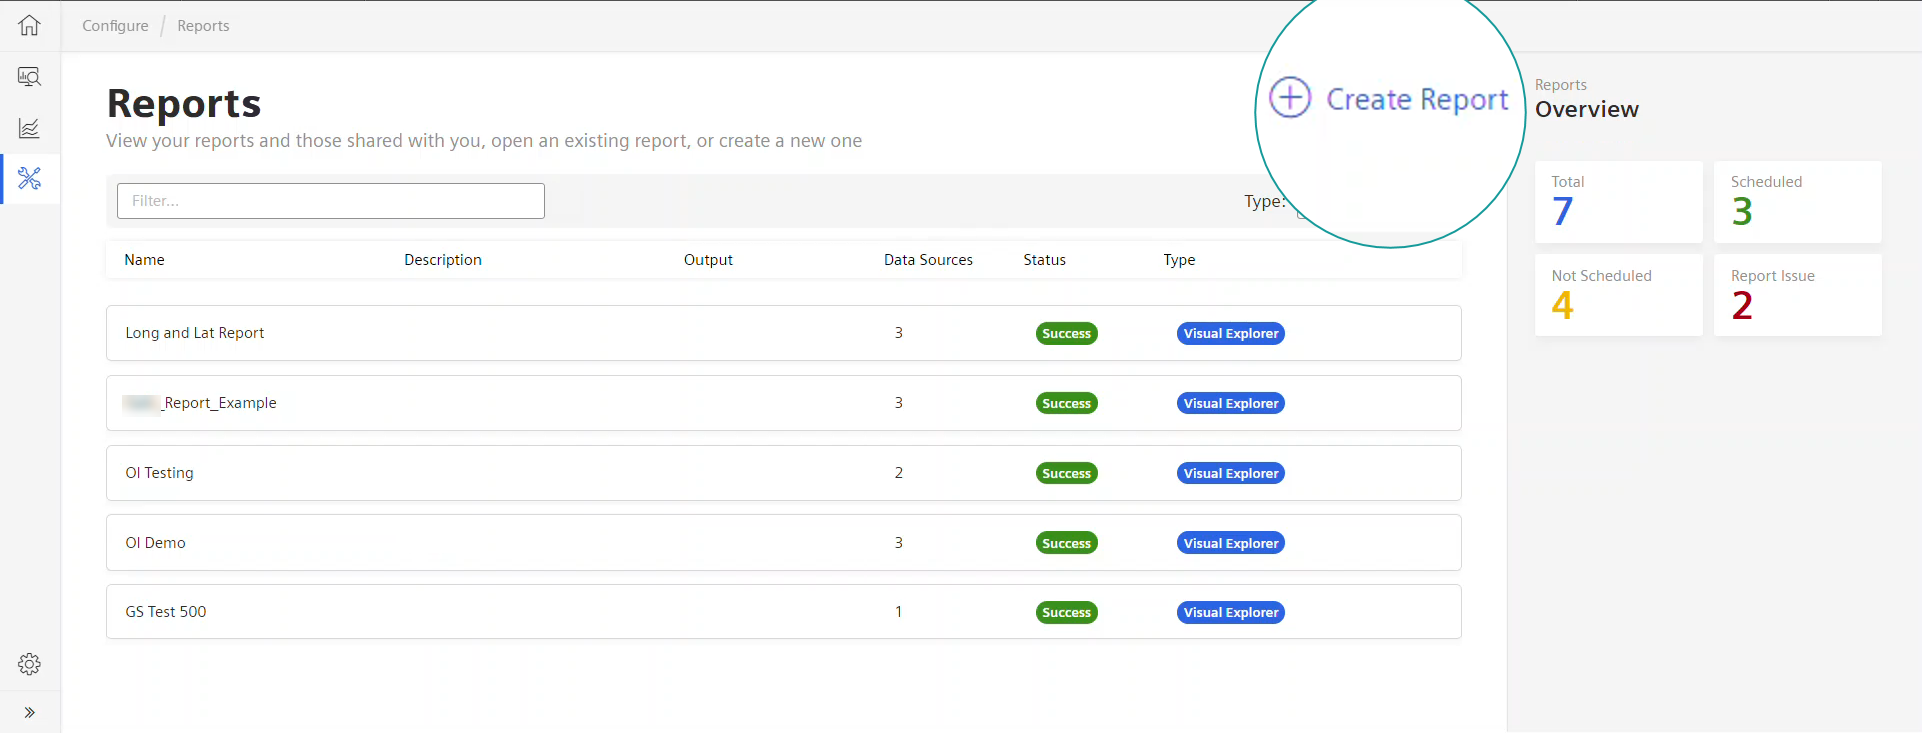
To start creating a report, click the Create Report link, as shown in this illustration:
Adding Data Sources to a Report
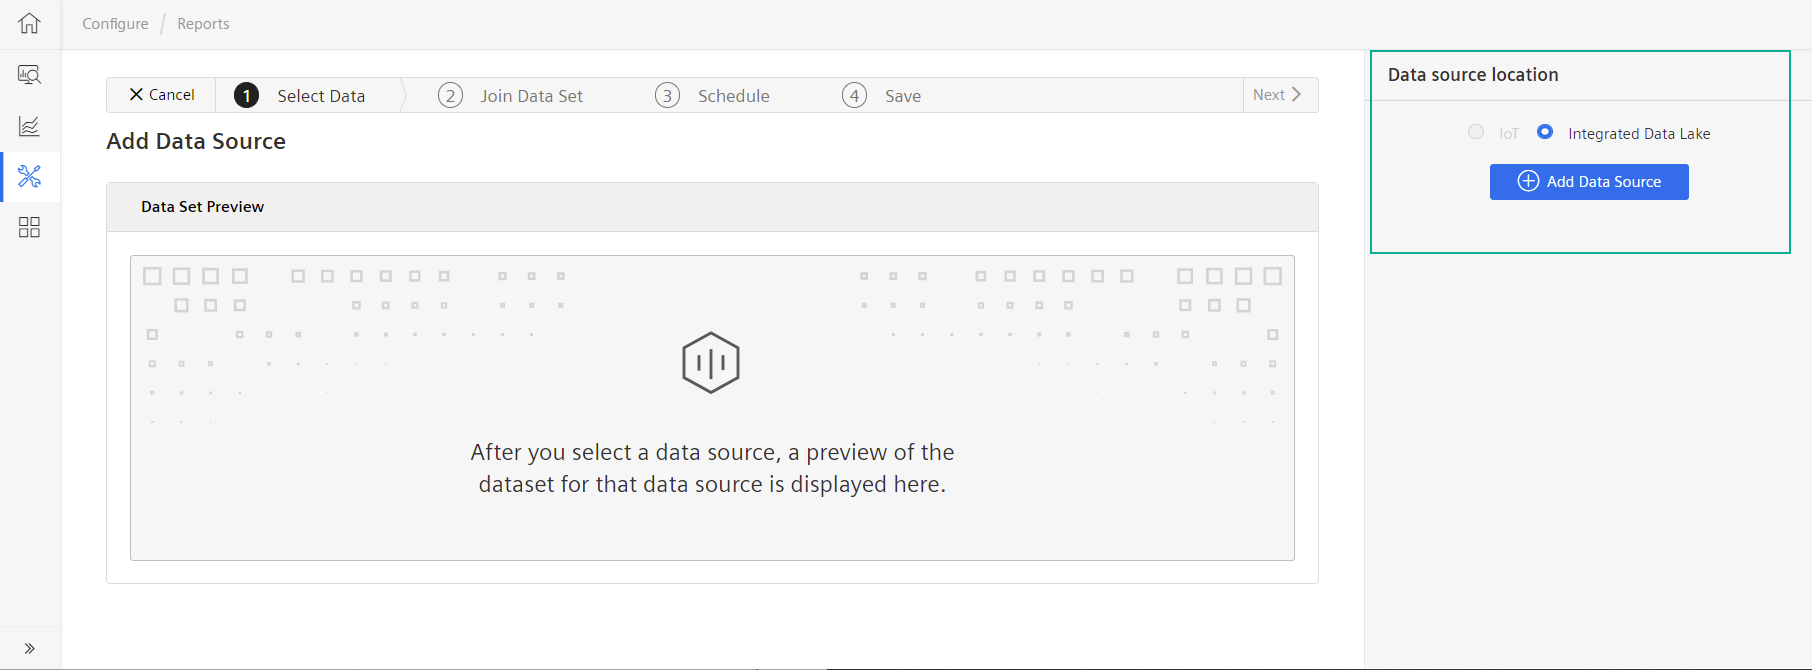
The first step is to select the ___location of the data source, and the example shows Integrated Data Lake radio button selected and the Add Data Source button activated:
How to Add Data Sources
Follow these steps to add a data source to a report:
- Select the radio button for the ___location of your data source. The data source selection window opens.
- Select the file type (CSV or Parquet) you want to add.
- Select the folder that holds your data source. Files contained in the folder display on the right side.
- Click the "Add Data Source" button.
Data Preview Table and Data Source Details
After you add a data source, its contents display in the preview table and a new tab displays in the Data Source Details panel, where you can view and select attributes to include in the report.
How to Select Data Source Attributes
Select data source attributes by:
- Sliding the toggle to select or deselect individual attributes, or use the Select All/None links.
Changing Data Types
There may be a need to change the data type of an attribute, for example, to create a joined dataset, the fields you want to join have to be of the same data type.
Change an attribute's data type by clicking the filter icon that appears when you hover over the attribute name. A dialog allows you to select another data type.
Selecting and Filtering Data
The right side of the page is where you select the data attributes to include in your report, add filters, and create joined datasets. You can:
- Select tabs to quickly view data source attributes, as well as joined datasets.
- Toggle off any attributes you don't want to include in your report.
- Add filters to attributes to narrow the data to use in the report.
- Set filters on time/date attributes to determine the date/time included in the report.
- Create joined datasets to merge data from fields in different data sources that represent the same type of data; e.g.,"Product Number" and "Part Number".
How to Select Data for your Report
Follow these steps to select data for your report:
- Select the tab for the data source you want to use. Data source information and attributes display beneath the tab.
- Slide the toggle to "off" for attributes you do not want to include in the report.
Changing an Attribute's Data Type
Follow these steps to change the data type of an attribute:
- Click the data source name.
- Click the Edit icon that displays when hovering over the attribute name in the Available Fields panel.
- In the Edit Field pop-up window, leave the Field Alias as-is, and enter an optional label to display in the UI.
- Select the data type you want the field to be from the Data Type drop-down list.
- Select a Unit of Measure that corresponds to the data type you select.
- Select a Partition Key if applicable and click "Update".
Adding Filters to Non-Date Attributes
Filtering allows you to focus precisely on the data you want in your report. When you add filters to an attribute a filter icon displays next to the attribute name. This is an example of where the filter icon displays when you hover over an attribute name.
How to Add a Filter to a Non-Date Attribute
Follow these steps to configure a filter for a non-date attribute:
- Select the filter icon next to an attribute you want to add a filter to. The Filter drop-down list opens.
- Select an operator (=, >, <, etc.) in the Filter field.
- Enter a character in the Value field. The filter is now active and a filter icon displays next to the attribute name.
Configuring the Date / Time Range for a Report
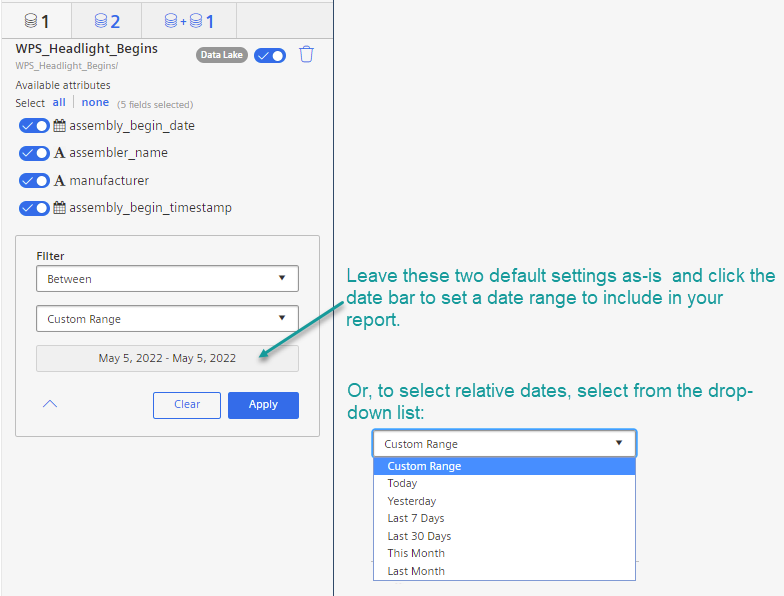
When you select one of the Date/Time attributes, the filter display defaults to "Between", but you can change it to another operator. You can add a fixed date range, custom date range, or you can click the drop-down caret to see relative date ranges, as shown here:
Joining Data
When you have fields/attributes in separate data sources that represent the same kind of data, for example, "date of manufacture" and "start date", you can join the data together for your report. The two attributes to be joined must be of the same data type; for example, if the "date of manufacture" field is "date" type, and the "start date" field is "timestamp" type, you cannot join them until one is changed to the same data type as the other.
Join Data functionality is shown in the following image, in which the user has already dragged fields from Data Sources 1 and 2 to the Join, named "Demo Join":

How to Create a Join by Dragging or Double-Clicking Attributes
Joining attributes together is optional. If you have added at least two data sources, you can proceed to the Join Data step. As the image above shows, the attributes included in the report display on the right side panel. You can either drag an attribute into the join form, or you can double-click the attribute and it will display in the data source field in the join.
Follow these steps to create a join:
- Enter a name for the joined dataset and select the tab for data source 1.
- Drag an attribute from the first data source to the first "Join on" field, or double click the attribute and it displays in its repsective data source field.
- Select the "data source 2" tab and drag the attribute to be joined to the second "Join on" field, or double-click the attribute. Click "Apply".
- To add an optional "Where" clause (condition), click the drop-down arrow in the "Join on" field and click "Add Where".
- Drag an attribute into the empty field, select an operator (=, >, or <), and enter a value.
- Click "Apply" to save the join.
How to add More Joins to the Same Join Group
Follow these steps to add an additional join to the join group you just created:
- Click the "+" icon next to the Apply and Cancel buttons.
- Repeat steps 2-5.
How to Create an Additional Join Group
To create an additional join group, click the Create Another Joined Dataset" button in the right side panel and follow the steps for adding a join, either by drag and drop or by entering a SQL query. An additional joined dataset must be saved with a different name.
How to Add a SQL Query to the Report
One of the most powerful features in OI Reports is the ability to add very complex queries using SQL. A hint about the syntax displays below the SQL query space.
Follow these steps to add a SQL expression to your report:
- Enter a name for the joined dataset.
- Select the "Add a SQL Query check box. A space opens for entering the SQL expression with a hint at the bottom that shows the expected syntax.
- Click Save. The system runs a validation check to confirm your entry.
Scheduling Reports
You can schedule reports to run automatically on the date and time you choose.
How to Schedule a Report
Follow these steps to schedule your report to run:
- Toggle on the "Enable Schedule" button in the Schedule Report Execution area. Radio buttons display with time increment choices.
- Select the time increment for running the report, e.g., hourly, daily, weekly, or monthly. Additional fields display according to your selection.
- If you selected "hourly", enter a time; if you selected "daily", "weekly", or "monthly", enter a day and time.
- Click Next. The Save dialog displays.
Saving a Report
Saving a report creates a listing on the Reports List page, and you can add a description and determine where to visualize the report.
How to Save a Report
Follow these steps to save your report:
- Enter a name for the report.
- Enter an optional description.
- Select a radio button to indicate whether to visualize the report in a Dashboard or Visual Explorer (VE).
- If you select VE for step 3, select a VE project from the drop-down list.
- Click "Finish". Your report is saved and displays in the table on the Reports List page.