OI Reports User Interface
The sections that follow discuss the features of the Reports User Interface (UI). To skip directly to the step-by-step instructions for creating a report, see the "Creating Reports" topic.
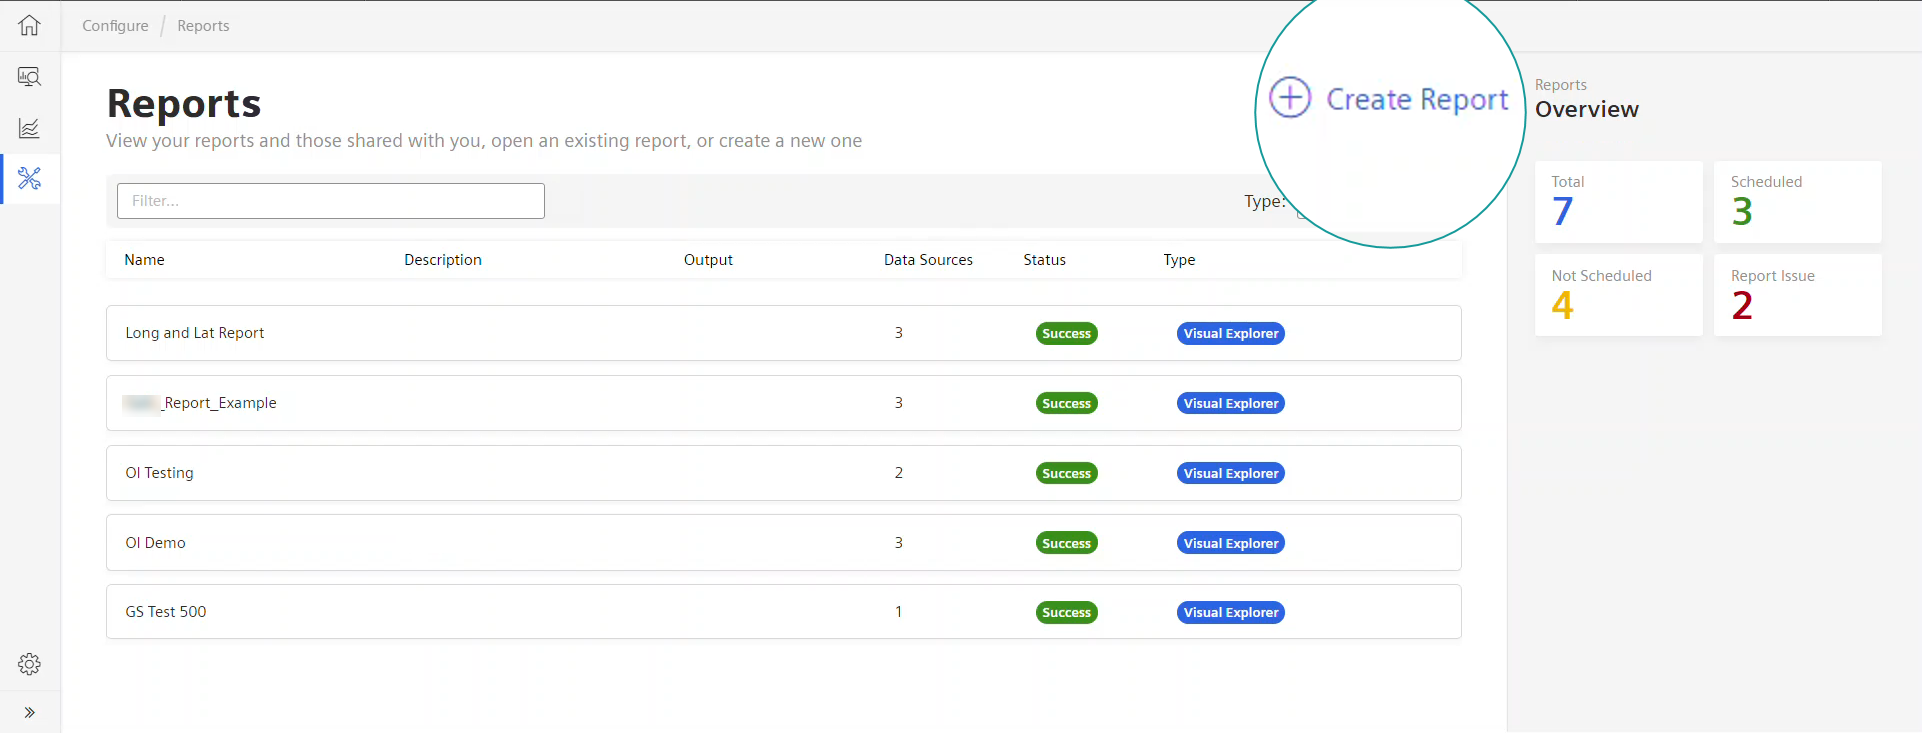
Creating a Report from the Reports Landing Page
This illustrates the Reports Landing page, where you begin creating a report by clicking the Create a Report link at the top of the page, as shown here:
Required and Optional Steps in Creating a Report
Creating a report includes:
Required steps:
- Adding data sources
- Selecting data source attributes to include
- Saving the report
Optional steps:
- Creating joins bewtween data sources
- Setting a schedule for automatically running the report
Progress Bar
The progress bar helps track where you are in the process of creating or editing a report. The Back and Next buttons facilitate moving to a next step or back to a previous step.

Tab Navigation for Data Sources
Tabs in the right panel allow you to easily switch between data sources as you configure your report. Each data source you add occupies its own tab, numbered serially as they are added. A joined dataset occupies its own tab, and displays the data source numbers involved in the join, for example DS1 + DS2.
The tab of the active data source is white, as shown in this example:
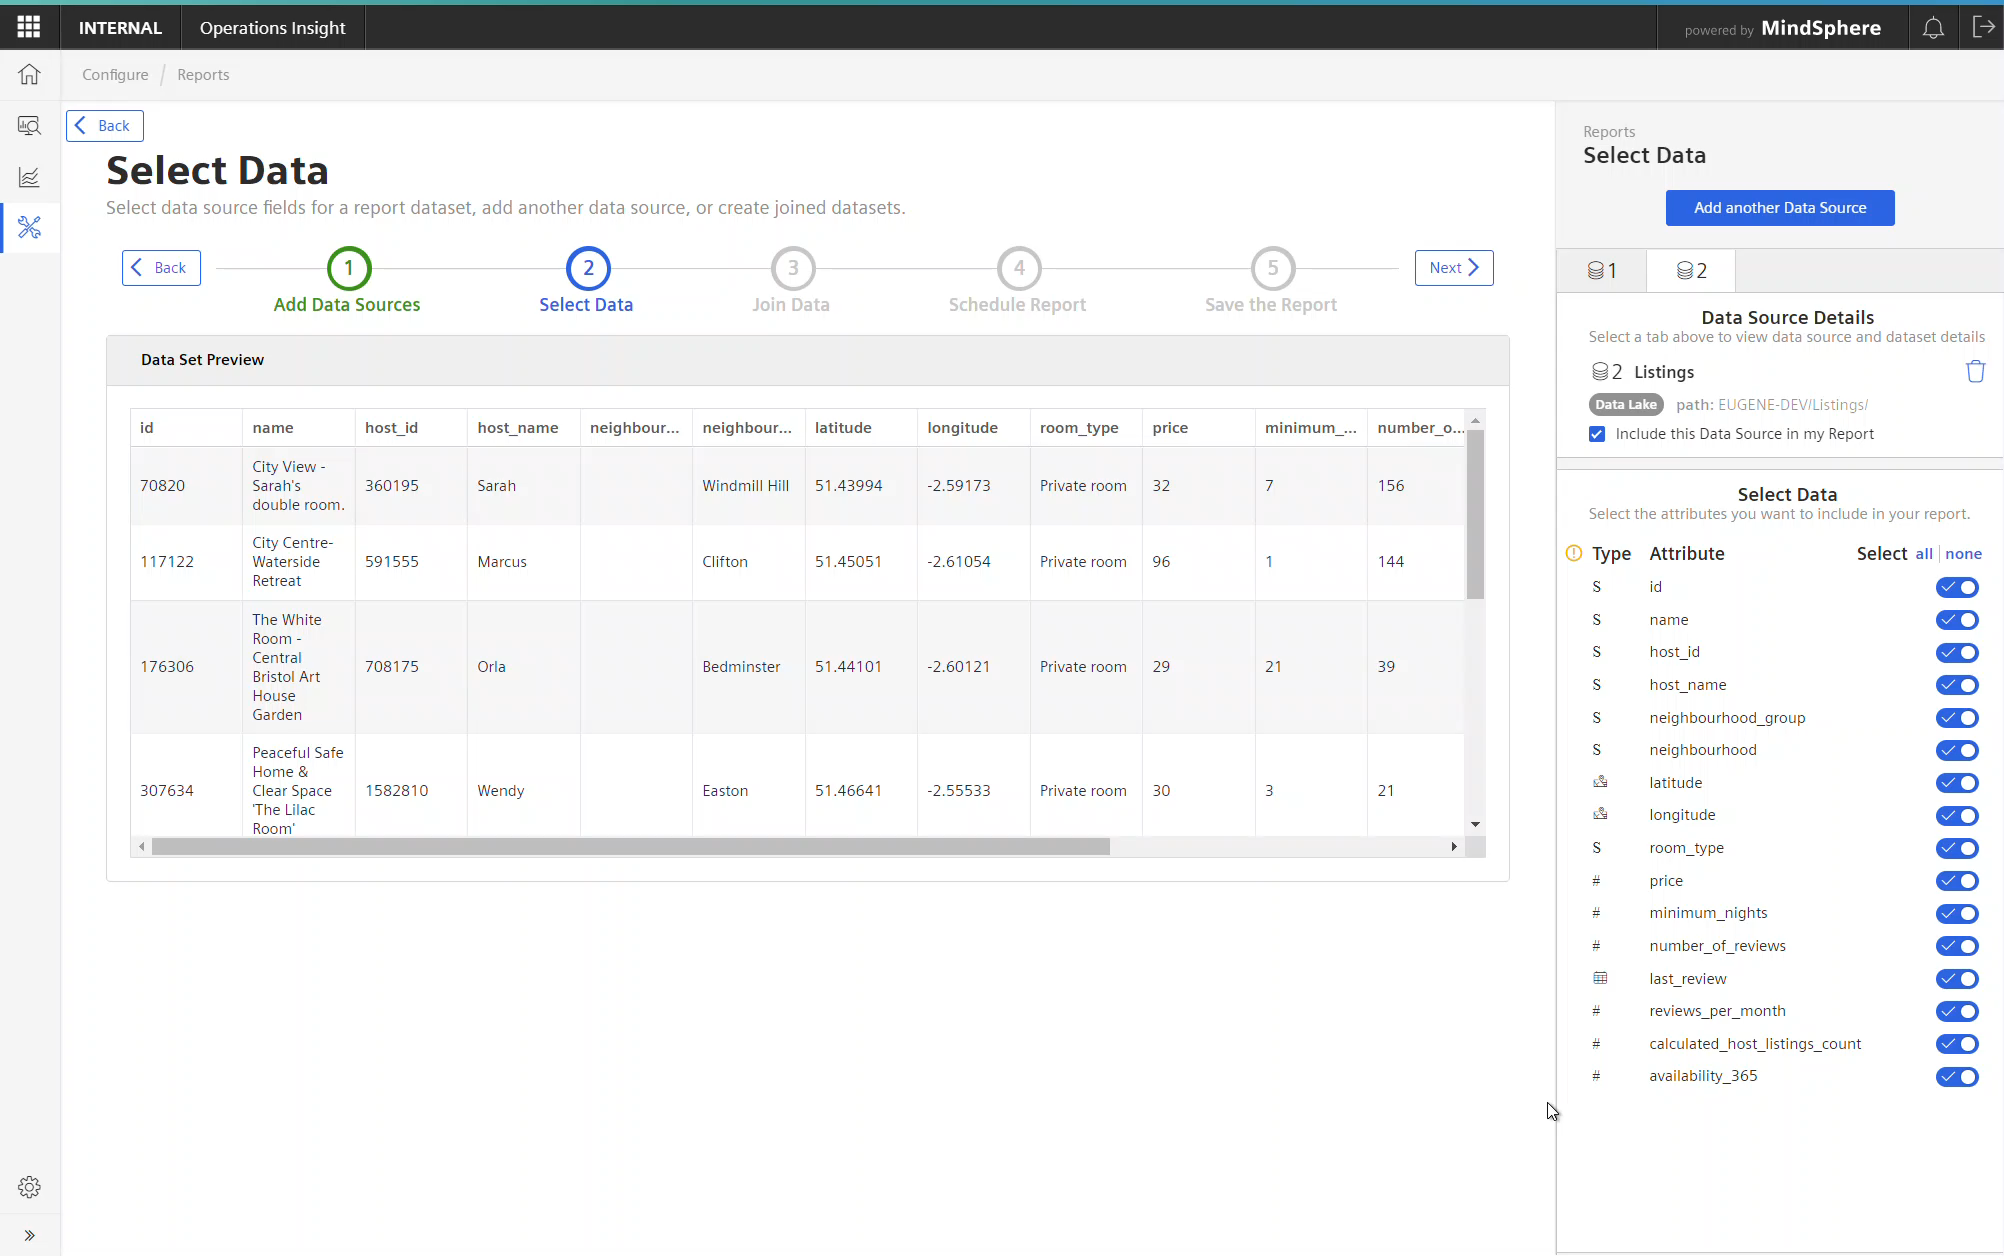
Responsive Data Preview Table
The Data Preview table responds to the data source tab you are on, the joined datasets you create, or the attribute and filter selections you make (in the right panel) for the active data source.