Insights Hub User interface of MindConnect IoT2050 Plugin
Manage the MindConnect IoT2050 Plugin UI from the Asset Manager. The below image displays the user interface of MindConnect IoT2050 Plugin.
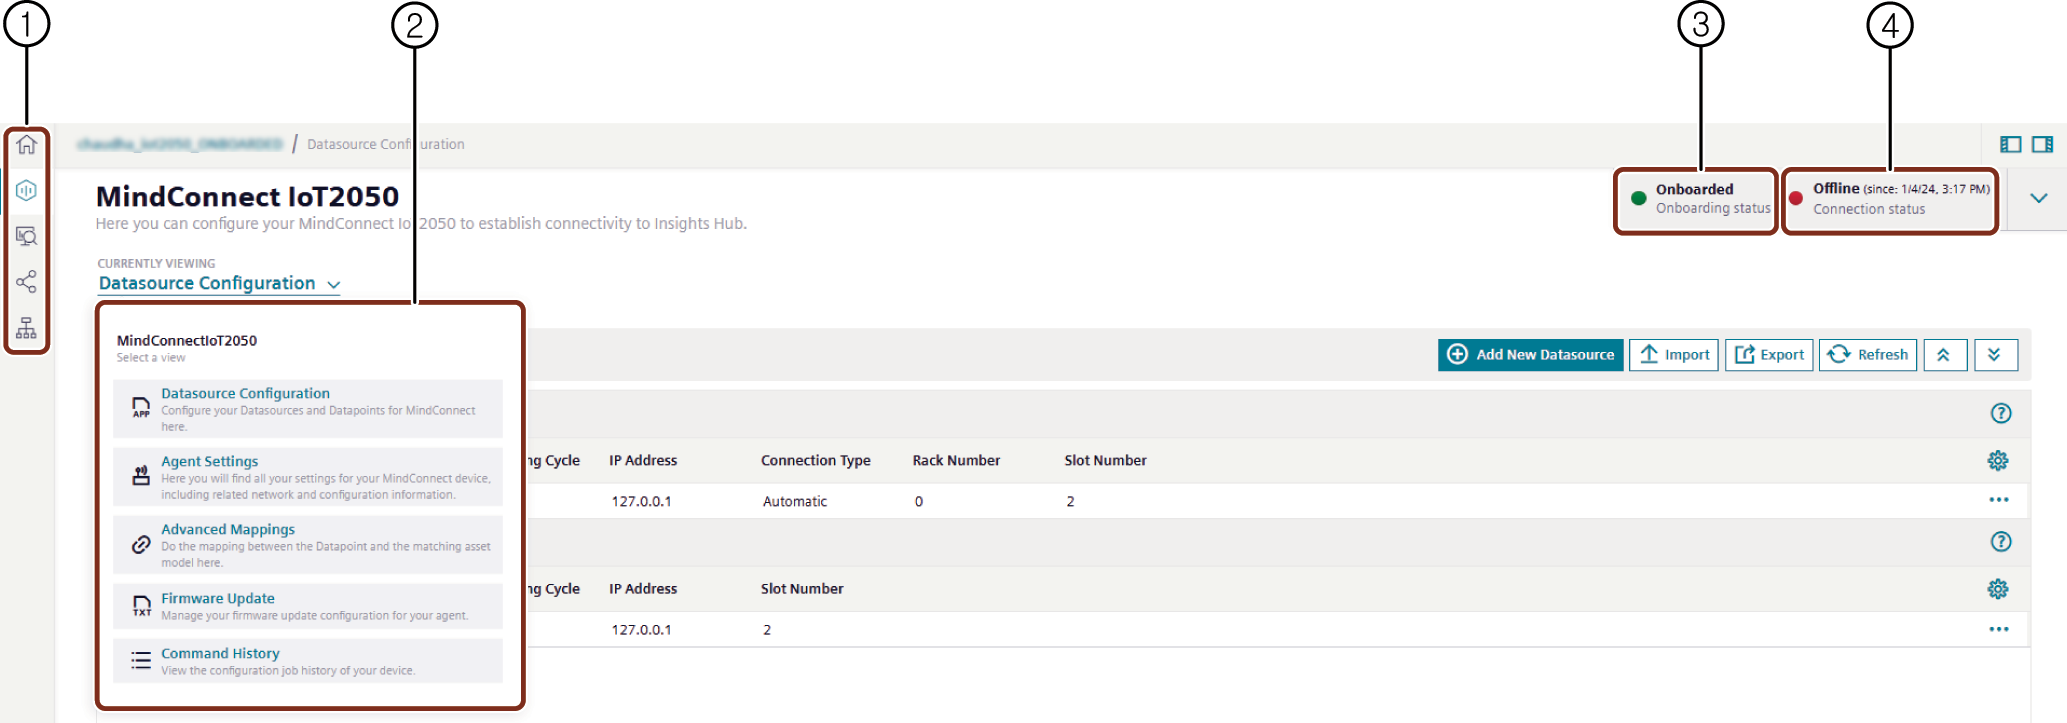
① Navigation icons to navigate between the different tabs are mentioned below:
- Home screen
- Assets
- Library
- Sharings
- Connectivity
② Select view for MindConnect IoT2050 plugin interface
③ Displays the device onboarding status
④ Displays the connection status to Insights Hub
The new UI is re-organized based on the functionality. Users can select and navigate directly to the corresponding view as listed below.
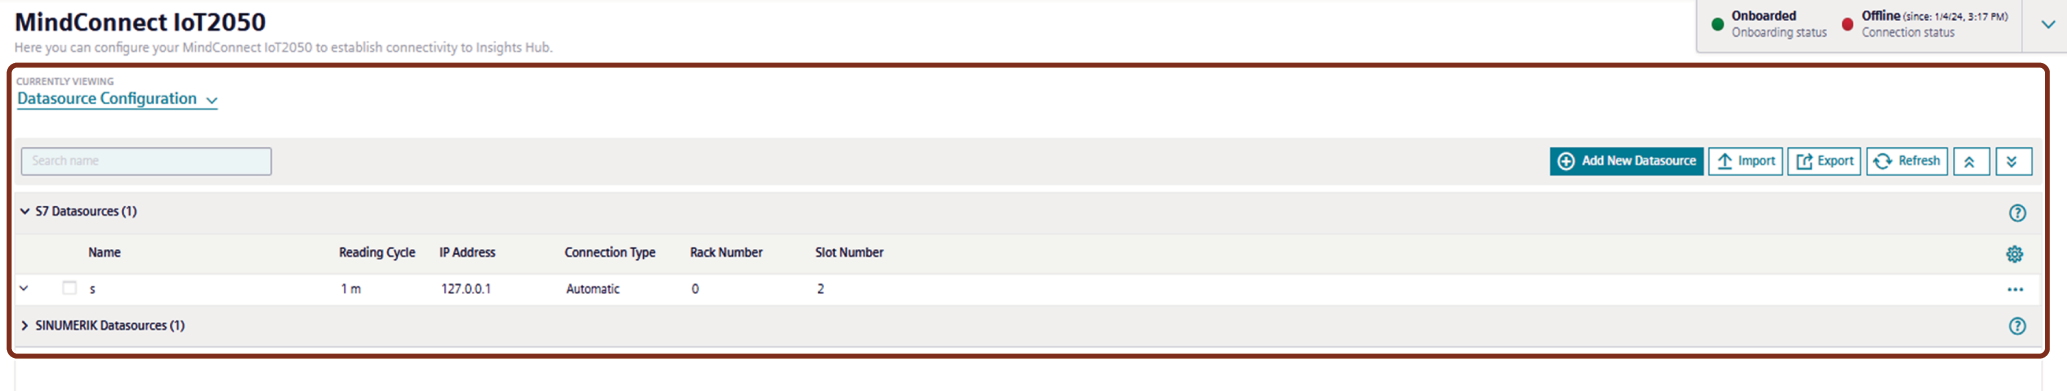
Datasource Configuration
Datasource Configuration view enables the user to configure the datasources, datapoints and also to map the datapoints. the user can use the "Refresh" option to discard the changes made.
Agent Settings view
In the "Agent Settings" view, user can find all the settings for MindConnect device including the related network and configuration information which enables the user to configure the agent. Agent settings view is shown in the below image.
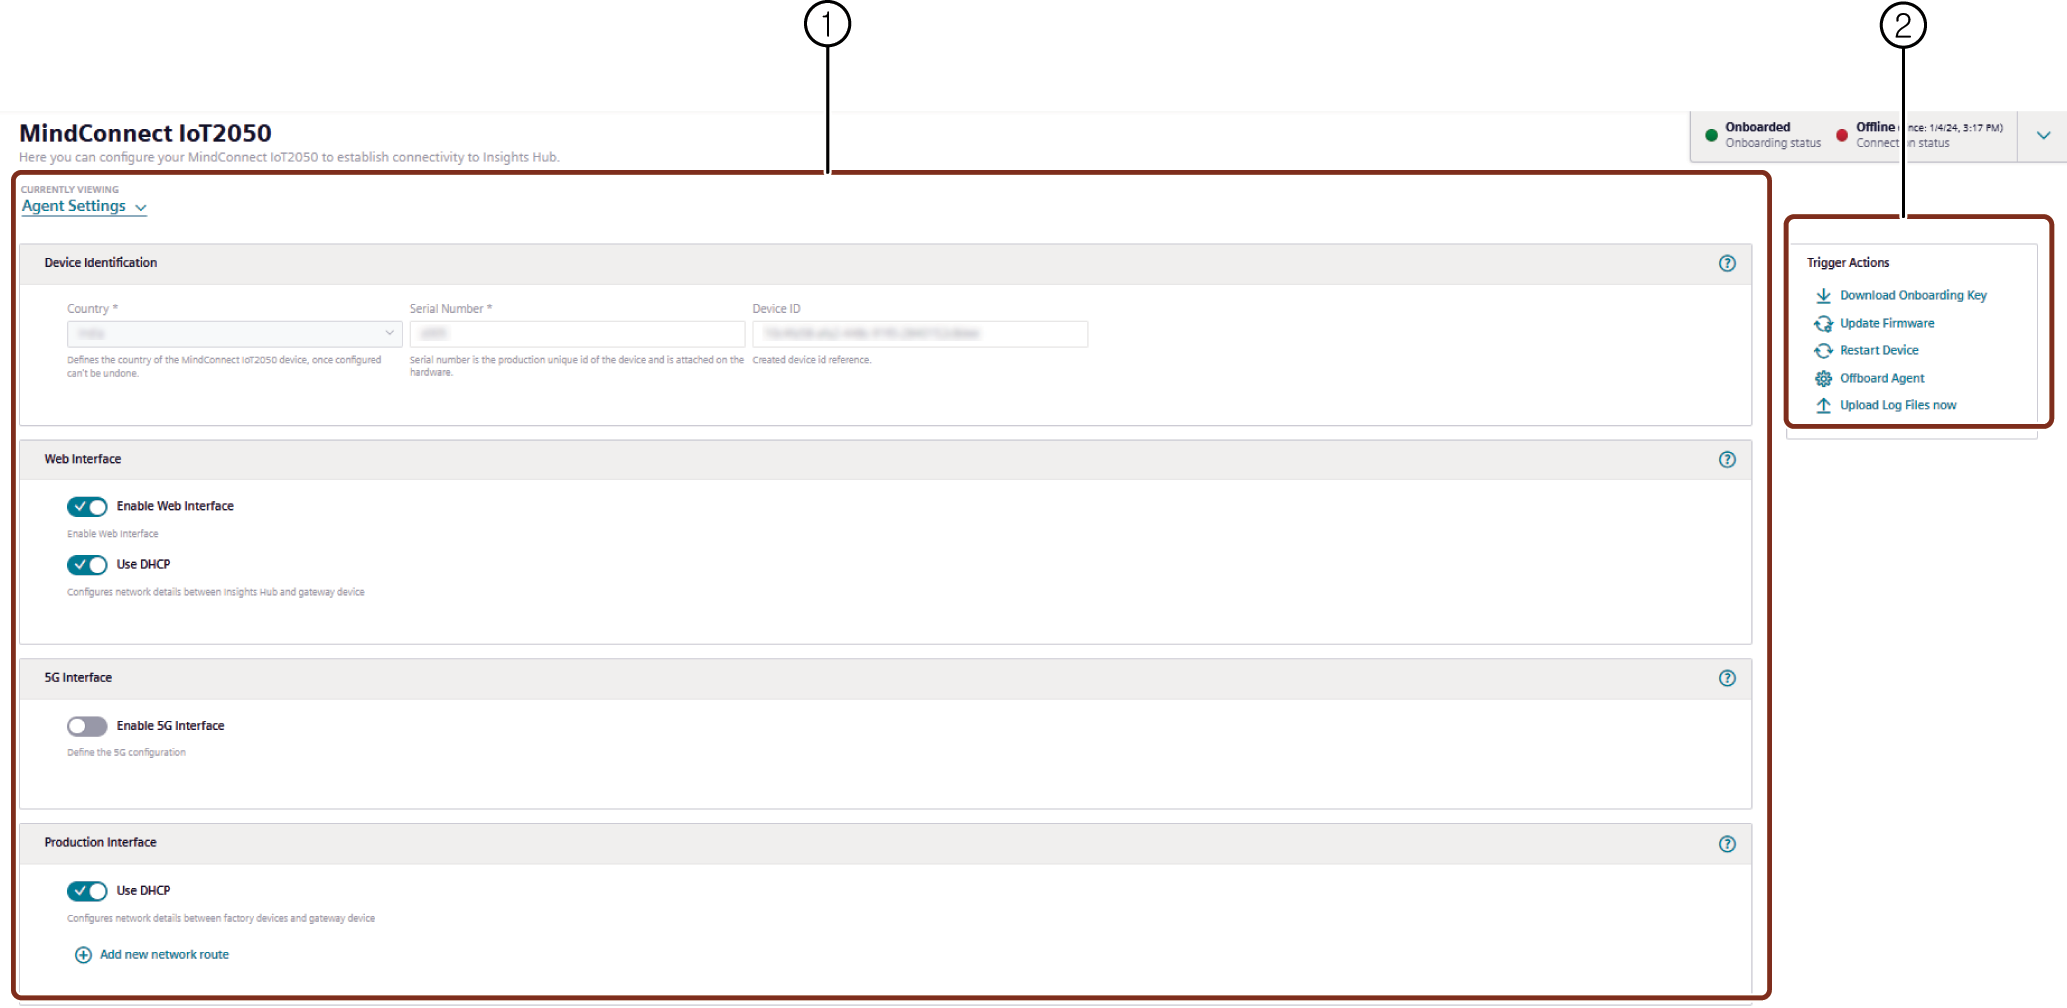
① Agent Settings - Agents are configured or modified in this window.
② Trigger Actions - Following are the options available in Trigger actions window,
- Download Onboarding Key: Downloads the Onboarding key to the local folder.
- Update Firmware: Updates to the latest firmware.
- Restart Device: Restarts the device.
- Offboard Agent: Offboards the Agent from the device.
- Upload Log Files now: Uploads all the generated logs to Insights Hub.
Advanced Mappings
In Advanced Mappings view, user can map the datapoint of a datasource to a variable.
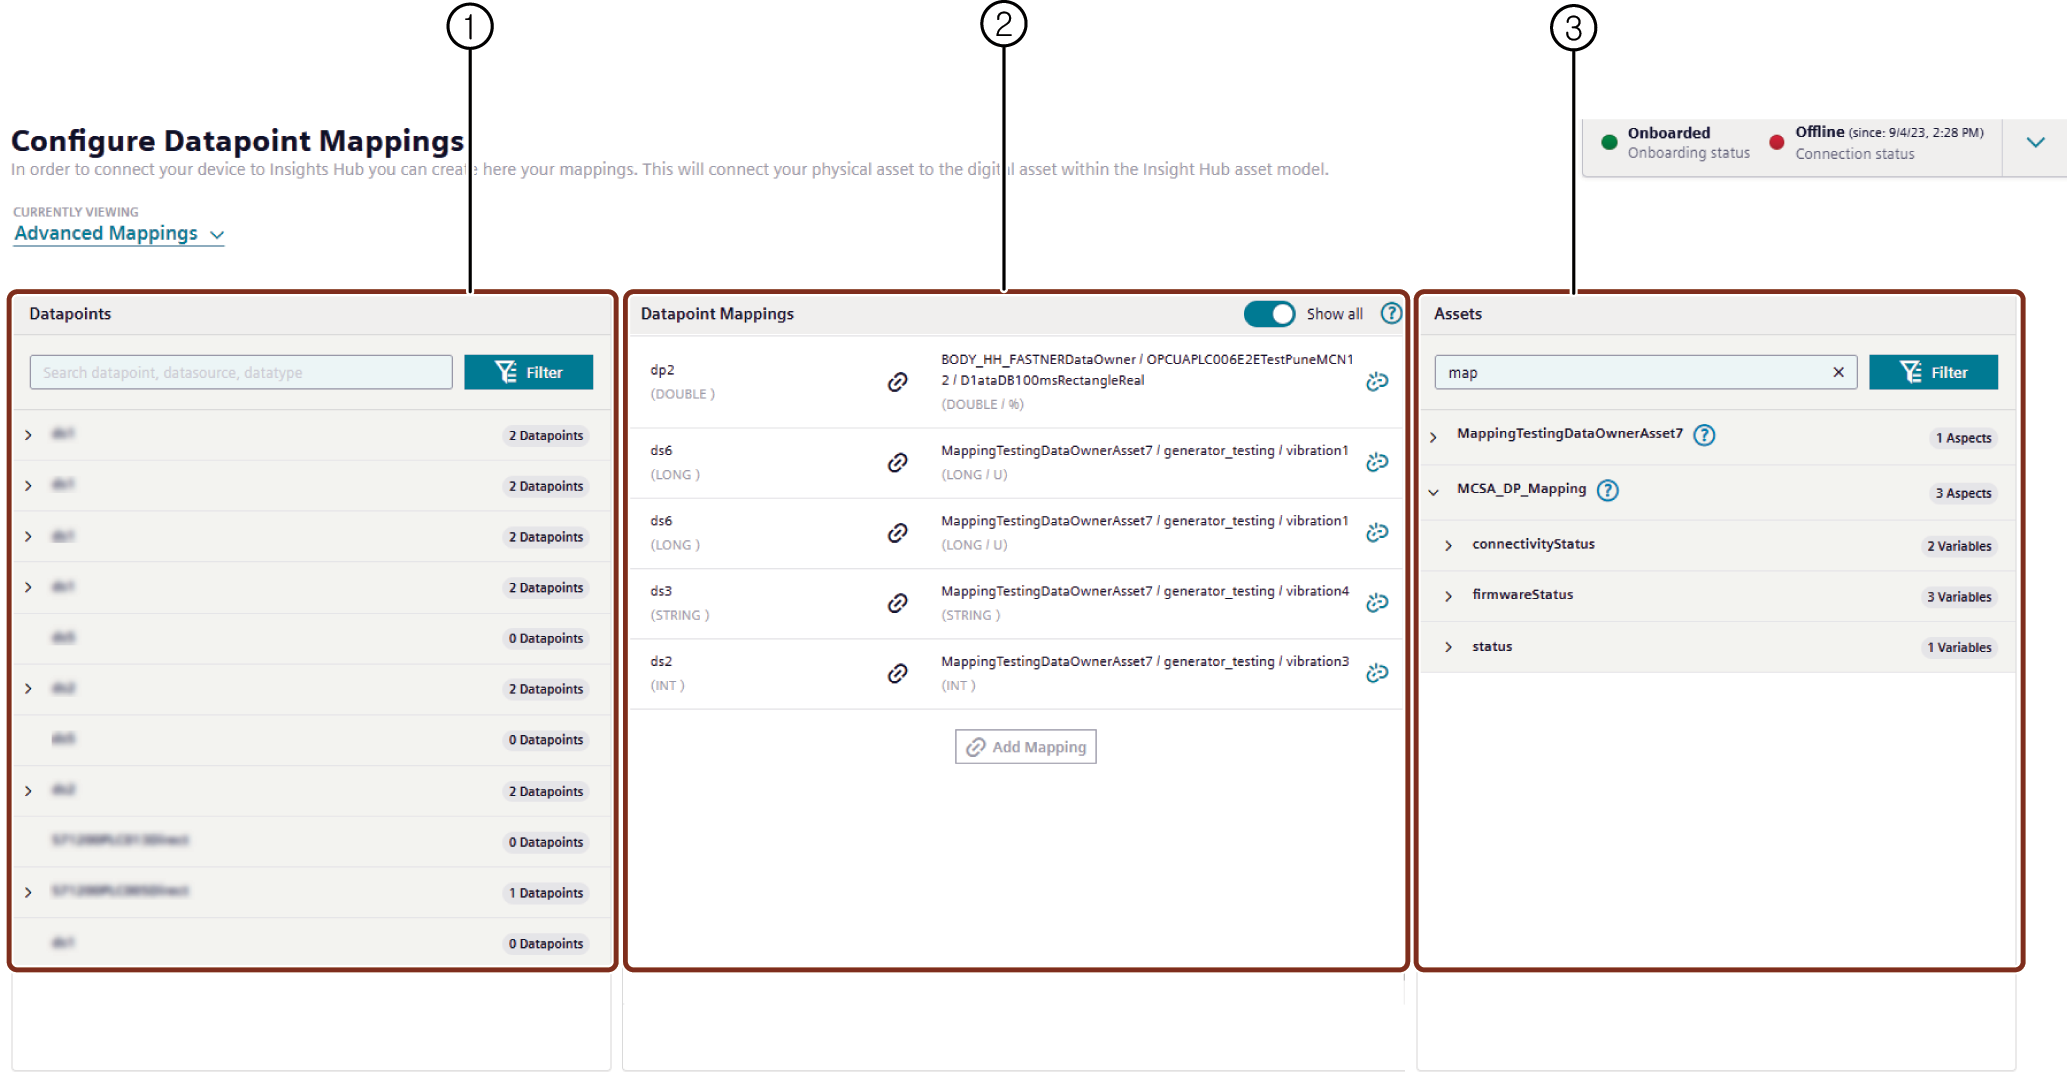
① List of datapoints available.
② List of datapoints mapped with variable.
③ List of variables available for the selected asset.
Firmware Update
In the "Firmware Update" view, user can manage and update firmware configuration for the agent.
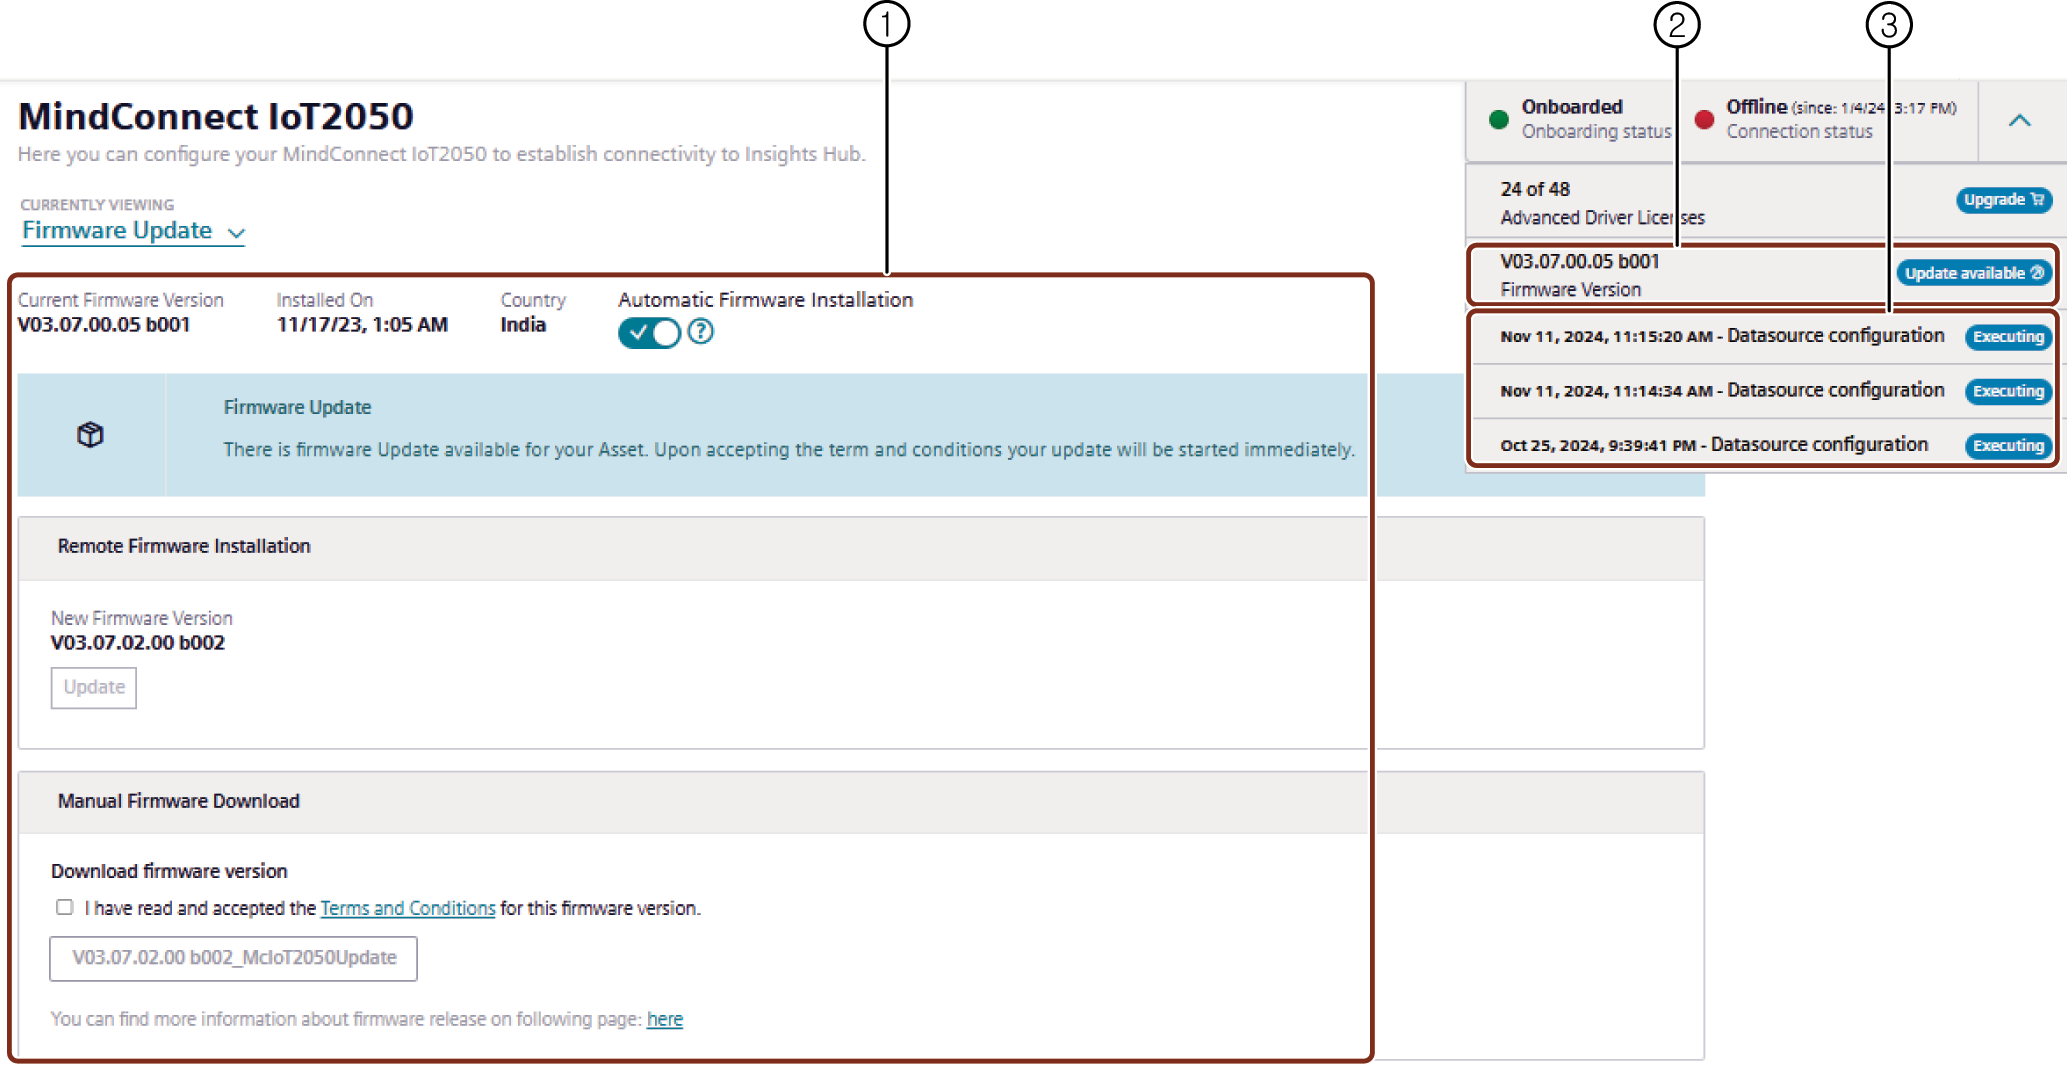
① Latest Firmware update is displayed
② Current firmware version
③ Displays the last three jobs status in the MindConnect IoT2050 UI.
Command history
The command history displays the status of the commands executed on the device.
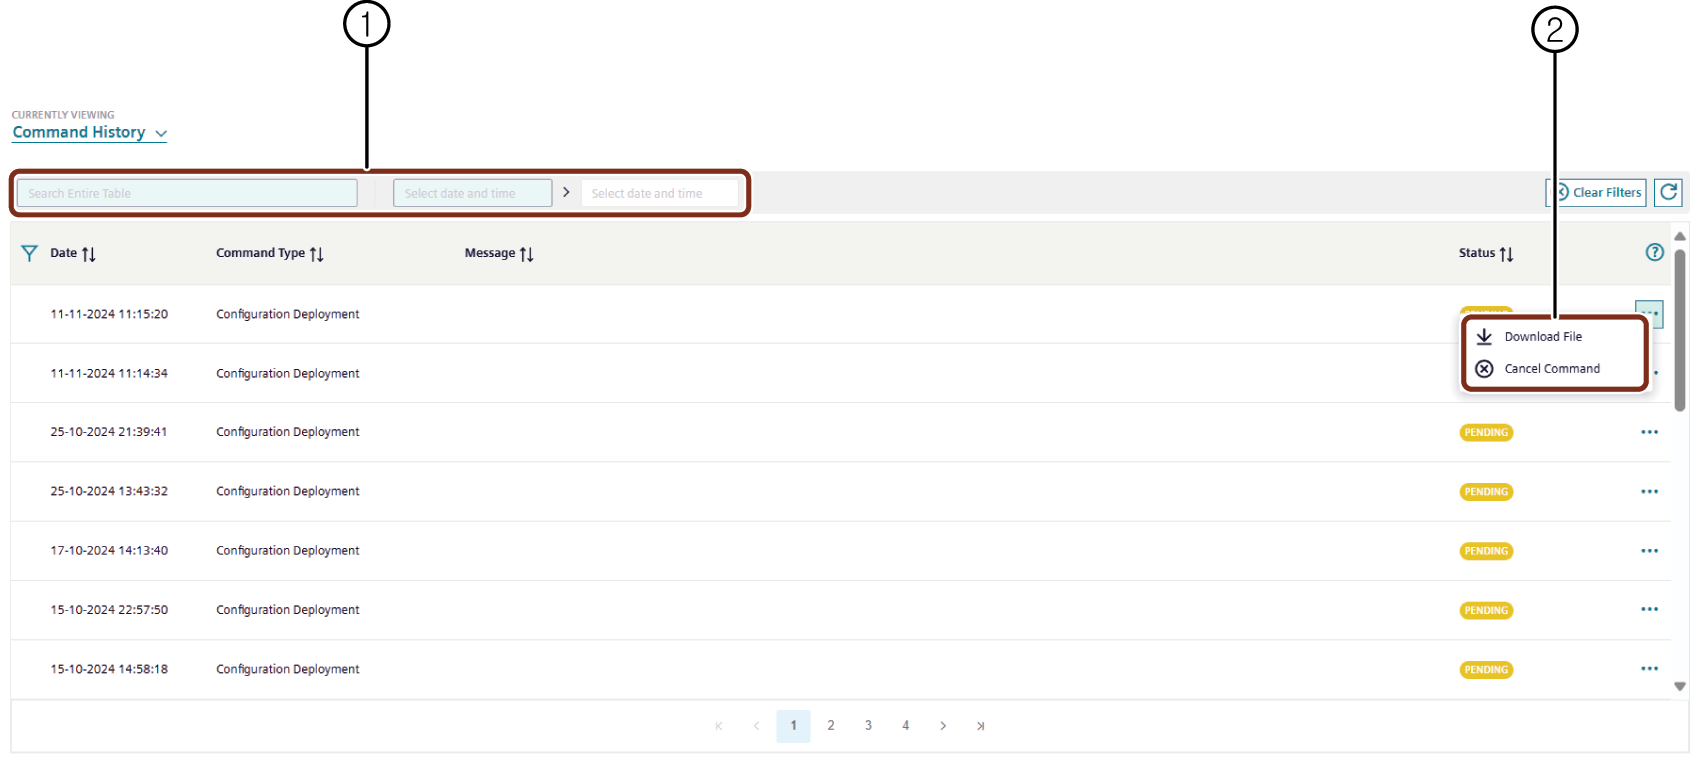
① Data Filters available for the command history:
- Apply filters to the entire table dataset.
- Filter data between specified date parameters.
- Each column supports individual filter options.
② Menu options available for each command:
- Download File: Downloads the configuration files configuration deployment commands.
- Retry : Firmware update command can be retried at Cancel or Failed status.
- Cancel Command : All commands can be cancelled at certain states specific to the command.
Diagnostics
The "Diagnostic" user interface provides insights of the operational status of the agent monitors. It is built upon the MindConnect API's Diagnostic Feature, this interface supports the activation, deactivation and message viewing functionalities for the agents. For more information on Diagnostic Feature refer to Developer documentation, section Diagnosing Exchange Service.
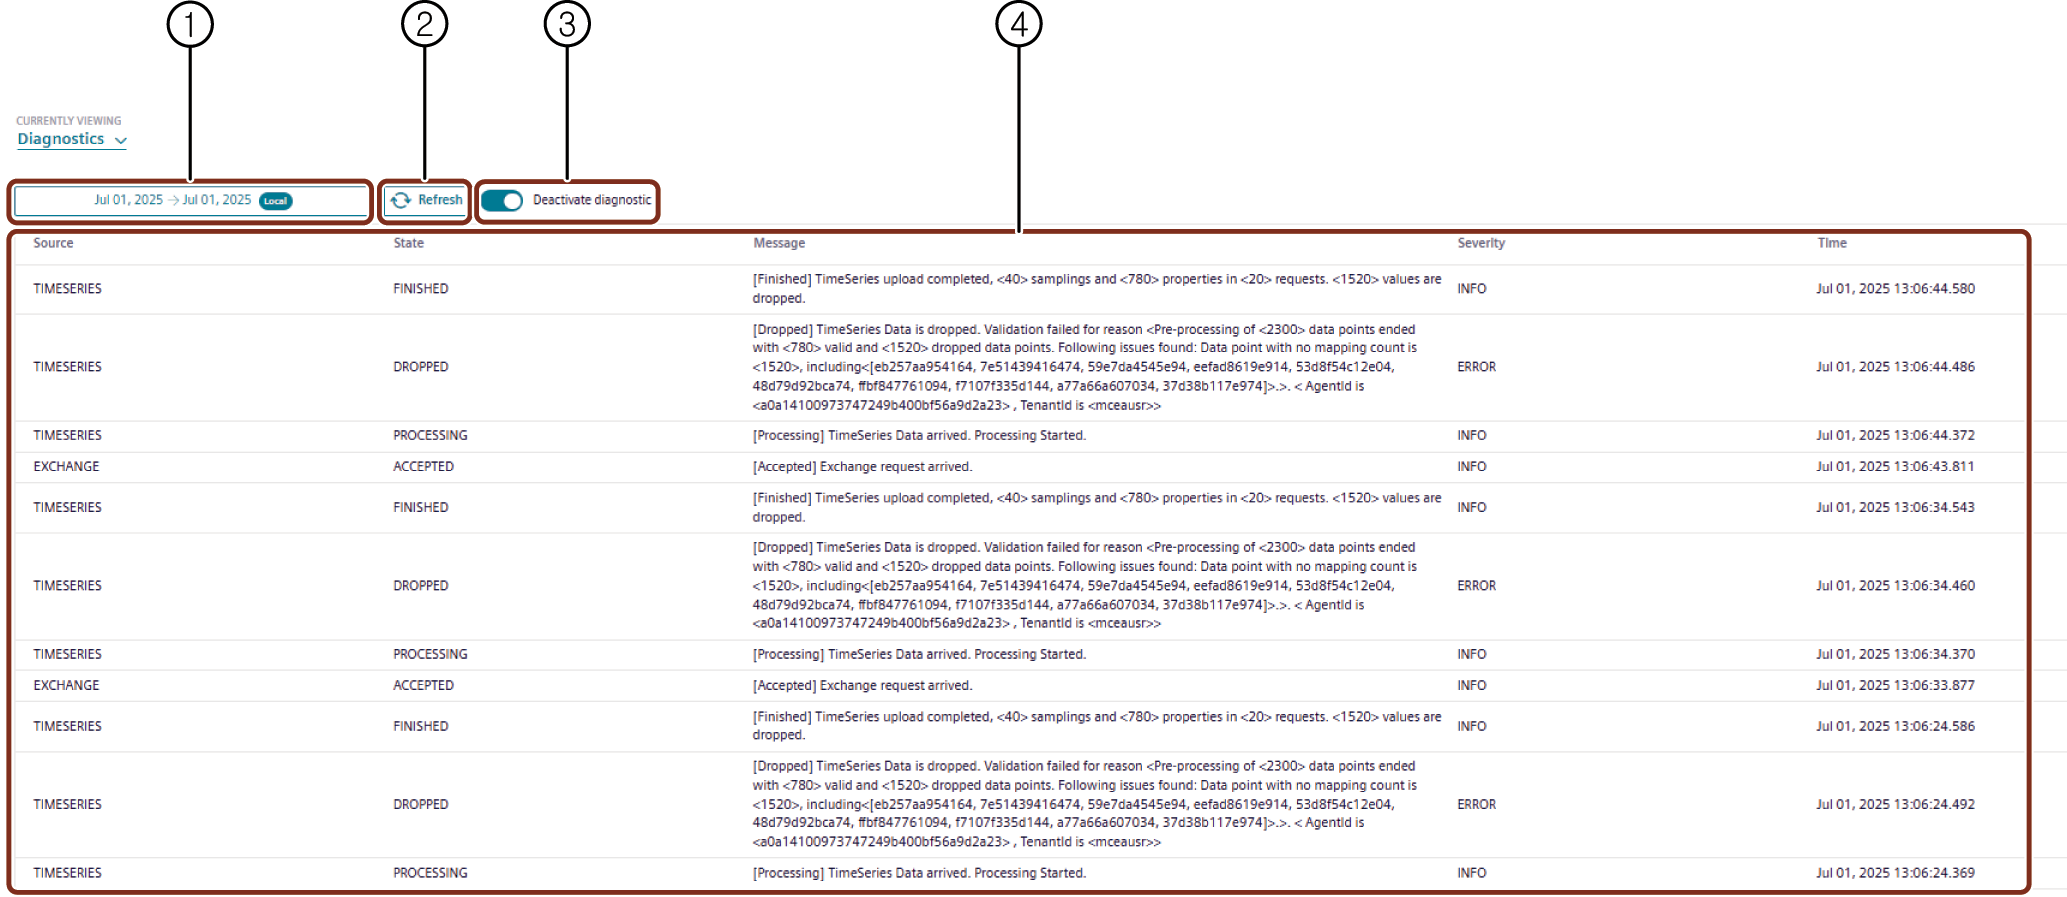
① Select the date range for which the diagnostics data is to be displayed.
② Refreshes the diagnostics data.
③ Activate/Deactivate Diagnostics - Activates or deactivates the diagnostics for the agent.
④ Displays the diagnostics data for the selected date range.
Activate or Deactivate Diagnostic
To activate or deactivate the diagnostics, enable "Activate/Deactivate Diagnostics" toggle. Once activated, the agent will start collecting diagnostic messages which can be viewed in the diagnostics data section along with the severity status.
Limitations
- The diagnostic service allows only five agents per environment with active monitorings in parallel.
- Diagnostic will be automatically deactivated after 1 hour. The diagnostic messages collected after activation will be automatically deleted after 7 calendar days.
MindConnect IoT2050 Plugin new UI features
The following are the main changes made in the new UI of MindConnect IoT2050 Plugin,
-
The configuration is downloaded direct to the device once saved(Apply changes is now not available).
-
All configuration changes are done within a single grid. In order to change any value the user can click the field and edit the changes.
-
On the top right, the "Jobs" icon is displayed which indicates the status. For example, a configuration is successfully deployed to the device.
-
The configuration grid can be changed using the gear icon.
-
Datasources is now mapped directly, click the mapping field and select the asset to connect. For more information, refer Datamapping.
-
The import of datapoints (including Browsing) is now integrated in a wizard style workflow. For more information, refer to Importing datasource
-
Grouping of datasources is available based on protocol.
-
Delete all datasources functionality is discontinued. Multi-select and delete operation on datasources is now supported.
-
Log column is discontinued in New UI.