Configuring Assets
Setting up the OEE assets is typically the last step in the configuration of Insights Hub OEE as it depends upon the configuration from the previous steps.
User interface
The user interface of "Assets configuration" is as shown below:

① Navigates to the "Configuration" page
② Tenant asset tree
③ OEE configuration panel for the selected asset
④ Navigates to the previous configuration step
⑤ Navigates to the next configuration step
An OEE asset is configured from an existing asset in the tenant asset tree. Those assets already configured as OEE assets are indicated with the  icon. When selected, the OEE configuration panel reads "Selected asset is an OEE asset". To remove the OEE asset, click the button and a warning box will ask for confirmation to delete the asset. This will remove the OEE asset configuration but the asset is not deleted from the tenant.

Procedure to create a new OEE asset
To configure a new OEE asset, scroll through and complete the configuration input options in the OEE configuration panel. Proceed as follows:
- Select the asset from the tenant asset tree.
-
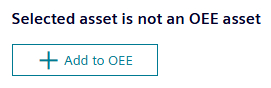
Click "Add to OEE". All configuration options will be displayed below.
-
Using the "Calendar" dropdown option, select a calendar that you have created previously. If the dropdown list does not include the appropriate calendar, then you can create it from the Calendar configuration page.
- Using the "Measure collection" dropdown option, select a measure collection that you have created previously. If the dropdown list does not include the appropriate measure collection, then you can create it from the Measures configuration page.
- Using the "Reject reason collection" dropdown option, select the appropriate reject reason collection that you have created previously. If the dropdown list does not include the appropriate reject reason collection, then you can create it from the Reject reason configuration page.
-
Scroll down to the "KPI targets". Here, you can modify the thresholds for KPI warnings and errors. These values will determine whether the KPI gauges, shown in the analysis pages, will be displayed in red, yellow, or green. It helps you to identify if you are currently achieving your OEE targets. In the following example, we see the warning and error limits for the OEE KPI:
- OEE Warning: 70%
- OEE Error: 60%
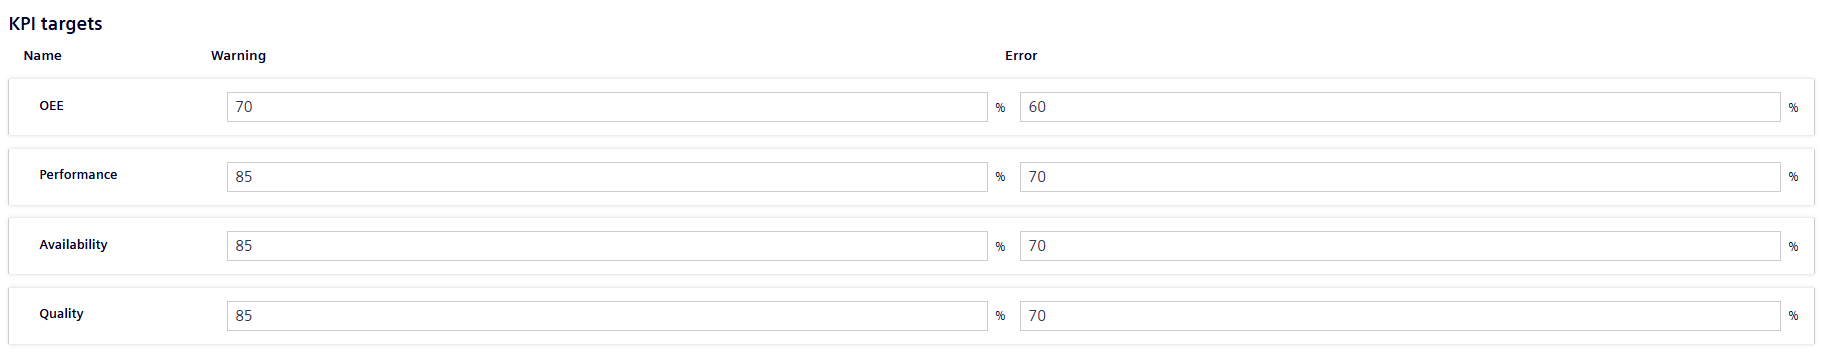
The values given in the configuration describe the upper levels. Therefore, in the OEE gauge it will display the following colors for the ranges:
- Red: 0 - 60
- Yellow: 60 - 70
- Green: 70 - 100
The gauges for Availability, Performance, and Quality follow the same approach.
- OEE Warning: 70%
-
Map the OEE variables. There are two variable types: Operands and Sources. The Operand Mapping and Source Mapping sections explain the mapping procedure in detail.
The following table summarizes the variables required to calculate OEE for an asset:
| Variable | Mandatory | Type |
|---|---|---|
| Status | Mandatory | Source |
| Order | Optional | Source |
| Product | Mandatory | Source |
| Good Parts | Mandatory or auxiliary expression | Operand |
| Rejected Parts | Mandatory or auxiliary expression | Operand |
| Total Parts | Mandatory or auxiliary expression | Operand |
The operand variables are part counters. It is required to define two out of three of them, then the third can be calculated through the auxiliary expression. The formula for the auxiliary expressions for Good Parts, Rejected Parts, and Total Parts are given in Configuring KPIs.
The source variables instead relate to the current activity of your OEE asset, for example the part or order that is being worked and the current operating status.
For all variables, the data can either be connected directly to the automation system via IoT time series or collected manually by the operator. Based on your configuration, you will be able to add certain data points in the manual inputs page.
Operand Mapping
In the Operand Mapping, map the counter variables for the Good Parts, Rejected Parts, and Total Parts. For each of these, select a mode. The following options are available for the different counters:
- Good Parts:
- Connected: A variable is available and can be mapped for the Good Parts counter
- Manual: The Good Parts will be provided manually via the manual inputs
- Calculated: The Good Parts are calculated based on the Total and Rejected Parts
- Rejected Parts:
- Connected: A variable is available and can be mapped for the Rejected Parts counter
- Manual: The Rejected Parts will be provided manually via the manual inputs
- Calculated: The Rejected Parts are calculated based on the Good and Total Parts
- Manual and Connected: In this mode, you connect a variable for the rejected parts but they can be increased afterwards again in case you need to adjust. For instance, your machine counter provides that you produced 480 rejected parts for a given time-frame, but number should be increased to 500 due to additional quality control afterwards, then you can do this change in the manual inputs section. Nevertheless, you need to be aware that the 20 additional rejected parts are subtracted from the good parts, if they are in the connected mode. A reduction of rejected parts is not supported, e.g. from 480 rejected parts to 460.
- None: Helps you to simply set the quality to 100%
- Total Parts:
- Connected: A variable is available and can be mapped for the Total Parts counter
- Manual: The Total Parts will be provided manually via the manual inputs
- Calculated: The Total Parts are calculated based on the Good and Rejected Parts
If you select either the "Connected" or "Manual and Connected" mode, you also need to select a type. The following two different types for the connected variables are available:
-
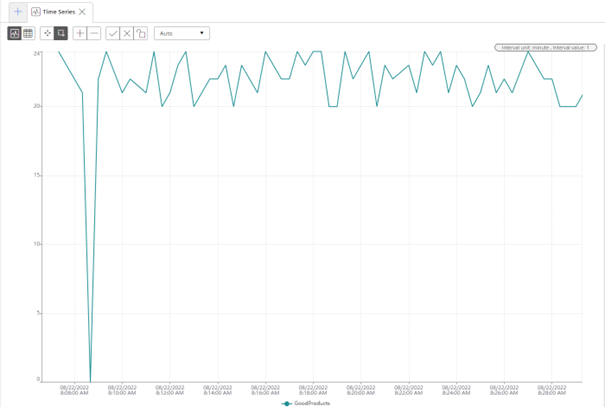
Difference Counter: The machine sends a counter value of the pieces, that were produced since the last time a counter value was sent to. In the image below, the value for the counter ranges between 20 and 24, this means that each time a counter value was sent to, 20 to 24 pieces were produced".
-
Absolute Counter: An absolute counter continuously counts up and is reset to 0 from time to time, for example, after a shift. In the image below, you can see a typical absolute counter.

Insights Hub OEE also automatically detects counter resets coming from the machine. Once the following value is 60% smaller than the previous value, then OEE will interpret this as a counter reset.
Timestamp Absolute counter value Delta value 12:00 1000 - 12:01 12 12 12:02 14 2 This behavior described in the table above would be interpreted as a counter reset by OEE, as seen in the delta values.
Timestamp Absolute counter value Delta value 12:00 1000 - 12:01 997 0 12:02 1001 1 This behavior described in the table above would not be interpreted as a counter reset by OEE. Here, the second value would be ignored by OEE.
Connected Example
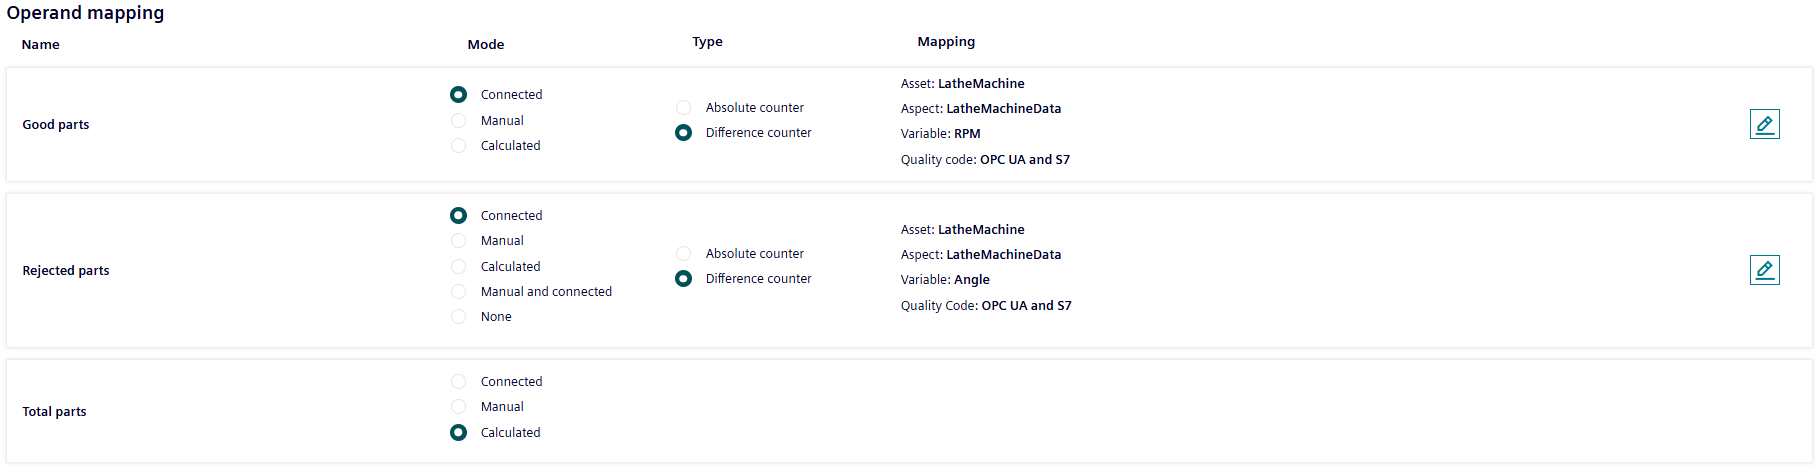
In the first example, for our "Capping Demo" asset, good parts and rejected parts are measured as connected difference counters, while the total parts are calculated through the auxiliary expression. To map these variables, proceed as follows:
- Select the Mode "Connected" and enter "Difference counter" using the radio button for the Good Parts.
-
Click the edit icon
 on the right side to open the Asset/Aspect selector. The following window is displayed:
By default, the aspects and variables of the "Capping Demo" asset are shown. Though it is permitted to map a variable from time series from a different asset, it is good practice to model your OEE assets with all required variables coming from aspects on that same asset.
-
Click the
 icon next to the variable of your choice. "Your selection" section displays the selected asset, aspect, and variable. In this example, the selected asset is "Capping Demo", the aspect is "MachineValues" and the selected variable is "GoodProducts". Additionally, you can also select a default quality code definition or a custom quality code definition. By default, the "OPC UA and S7" option will be selected. If the data point has no quality code attached, this selection does not have any effect. Only if the selected variable also uses quality codes, will these be evaluated by Insights Hub OEE. To learn more about quality codes refer to Configuring Quality Codes.
 - Once the selection is done, click "Select".
- For Rejected Parts, follow steps 1 to 4 again.
-
For measuring the "Total Parts", proceed as follows. Select the Mode "Calculated" using the radio button. The following screen shows the completed Operand Mapping for a connected asset:
Note
Two other scenarios are also possible here:
Scenario 1: Rejected Parts and Total Parts measured through variables. Therefore, select "Calculated" as the type for Good Parts and "Good Parts" from the dropdown.
Scenario 2: Good Parts and Total Parts are measured through variables. Therefore, select "Calculated" as the type for Rejected Parts and the "Rejected Parts" from the dropdown.
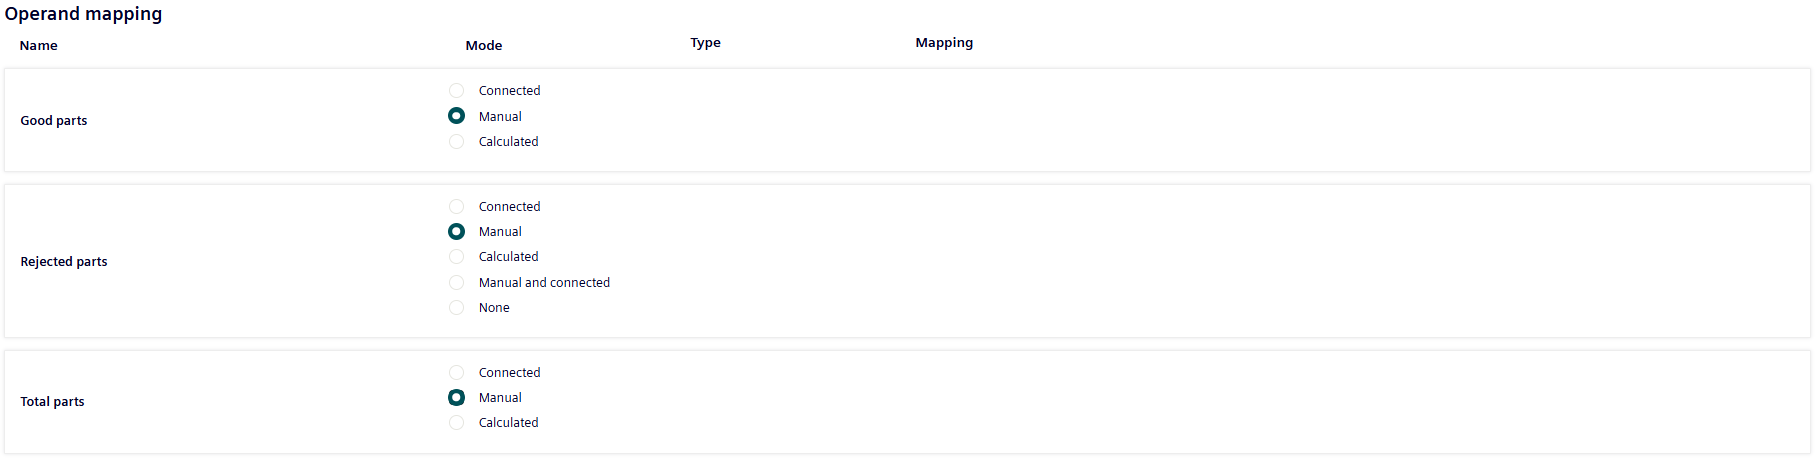
Manual Example
In this section, a complete manual example will be provided.
- Select the Mode "Manual" using the radio button for the Good Parts.
- Select the Mode "Manual" using the radio button for the Rejected Parts
- Select the Mode "Calculated" using the radio button for the Total Parts.
In the manual mode, all counters are treated as difference counters and therefore it is not required to select a type. The following screen shows the completed Operand Mapping for a manual asset:
Next step in the configuration is Source Mapping. Insights Hub OEE also provides both connected and manual options.
Source Mapping
The Source Mapping follows a similar approach compared to Operand Mapping. In this section, two examples, one manual and one connected will be provided.
In the Source Mapping, for order, product and status multiple modes exist again:
- Order:
- Connected: A variable is available and can be mapped for the order information.
- Manual: The order information will be provided manually in the manual inputs section.
- None: No order is needed and there this filter option is disabled.
- Product:
- Connected: A variable is available and can be mapped for the product information. The system will read the product information from the variable.
- Single: A single product from a product collection is chosen by the user, no further specification of a variable is required.
- Manual: A product collection needs to be selected by the user and the product itself is then selected from the collection in the manual input section.
-
Design Speed:
- Connected: A variable is available and can be mapped either for the design speed or cycle time. The system will read the design speed information from the variable.
- Via Product: The design speed is read from the associated product code that the system receives. Also, use this option if you want to set the Design Speed as a manual input. Here, you have to specify different products with the associated design speeds and then select the products from the dropdown. This approach reduces errors when typing in design speeds.
- Fixed: The user can enter either a speed or cycle time in the configuration which is fixed for this asset.
-
Status:
- Connected: A variable is available and can be mapped for the status information. The user also needs to specify a status mapping
- Manual: The status is provided manually via the manual inputs. The user also needs to specify a reason tree.
The following table shows some common combinations for Product & Design Speed:
| Product | Design Speed | Use Case |
|---|---|---|
| Connected | Connected | Equipment provides both product code and design speed and therefore the design speed information from the variable will be used and the product information to contextualize the calculated KPIs. |
| Connected | Via Product | Equipment only provides product code information. This is used to determine the design speed. |
| Connected | Fixed | Different products are produced at the same speed. |
| Single | Connected | Only one Product is produced and the design speed can be fetched from the machine. |
| Single | Via Product | Only one product is produced at that equipment. |
| Single | Fixed | One Product is produced at a fixed design speed. |
| Manual | Connected | The design speed is read from the equipment and the product is set manually. |
| Manual | Via Product | The product information is provided manually by the operator and the design speed is fetched from the configured design speed of the product. |
| Manual | Fixed | Equipment is producing at a constant design speed and the product is set manually. |
Connected Example
To configure the source variables, proceed as follows:
-
Click the edit icon
on the right side to map the Order information. The following Asset/Aspect selector window appears: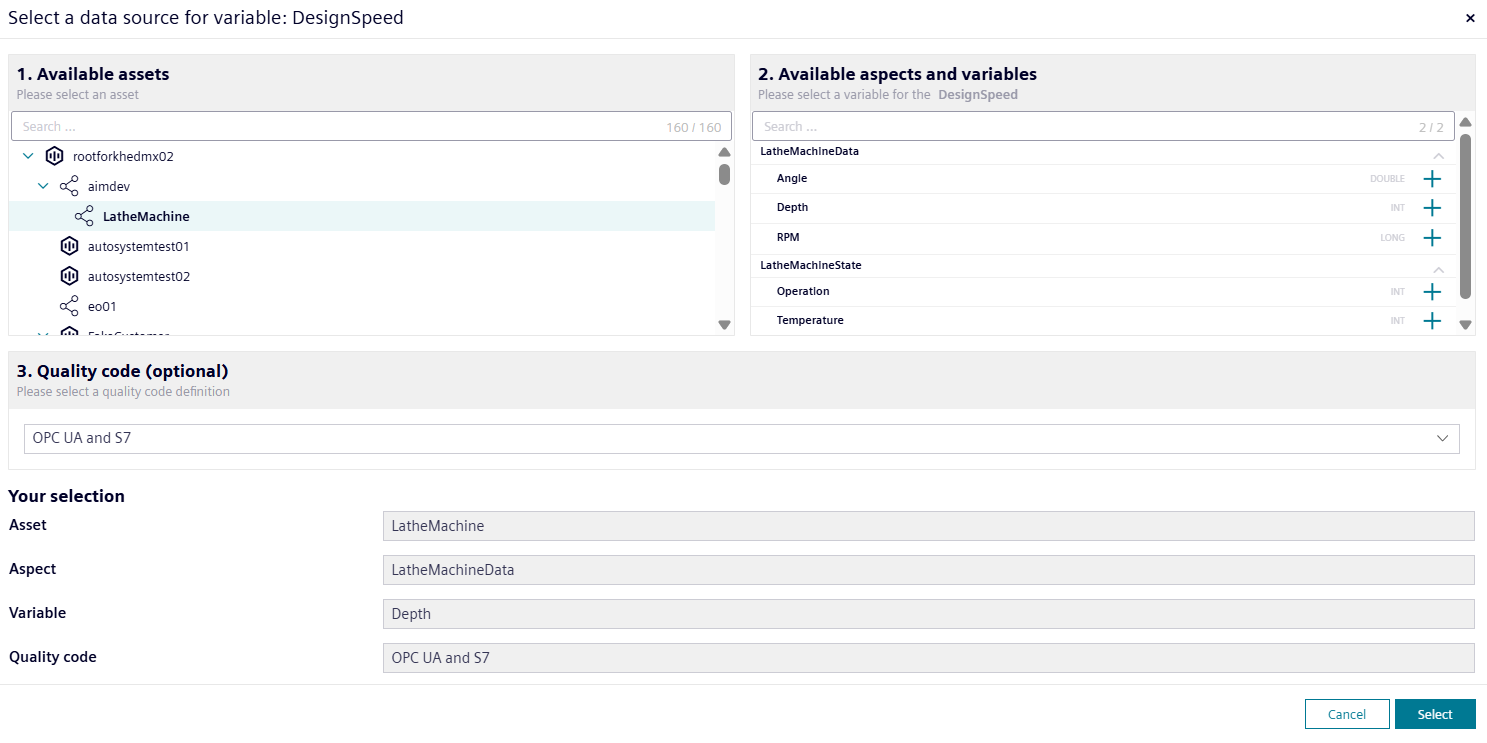
-
Click the
icon next to the variable of your choice. "Your selection" section displays the selected asset, aspect and variable. In this example, the selected asset is "Capping Demo", the aspect is "MachineValues" and the selected variable is "OrderID". You can select a quality code similarly to the operand mapping. - Once the selection is done, click "Select" and the window will close.
-
For Product, select the relevant product collection from the dropdown. Then, select the required mode. If it is "Connected" then map a time series variable using the selection dialogue as before. If you select the single product option, choose one product from the "Single Product" dropdown. This means that the asset only produces one product and therefore a variable mapping is not necessary.

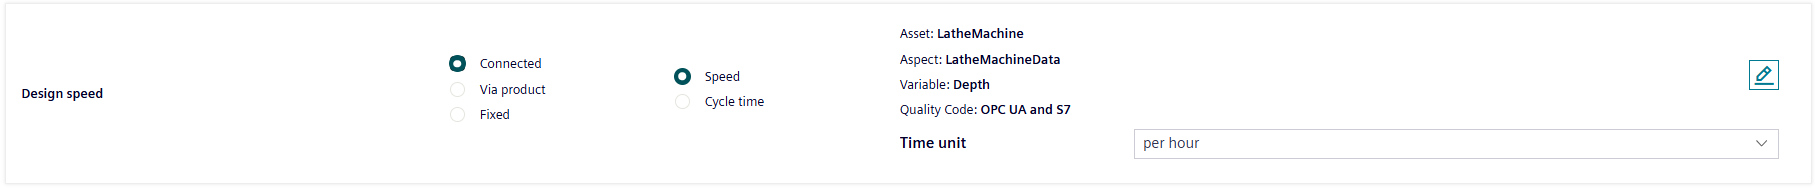
-
For Design Speed, if you select "via Product", then the Design Speed configuration is already completed.

Instead, if you select "Connected" for the Design Speed, specify whether the data is a Speed or a Cycle time; select the variable via the edit icon and the subsequent dialogue, and select the appropriate Time unit.
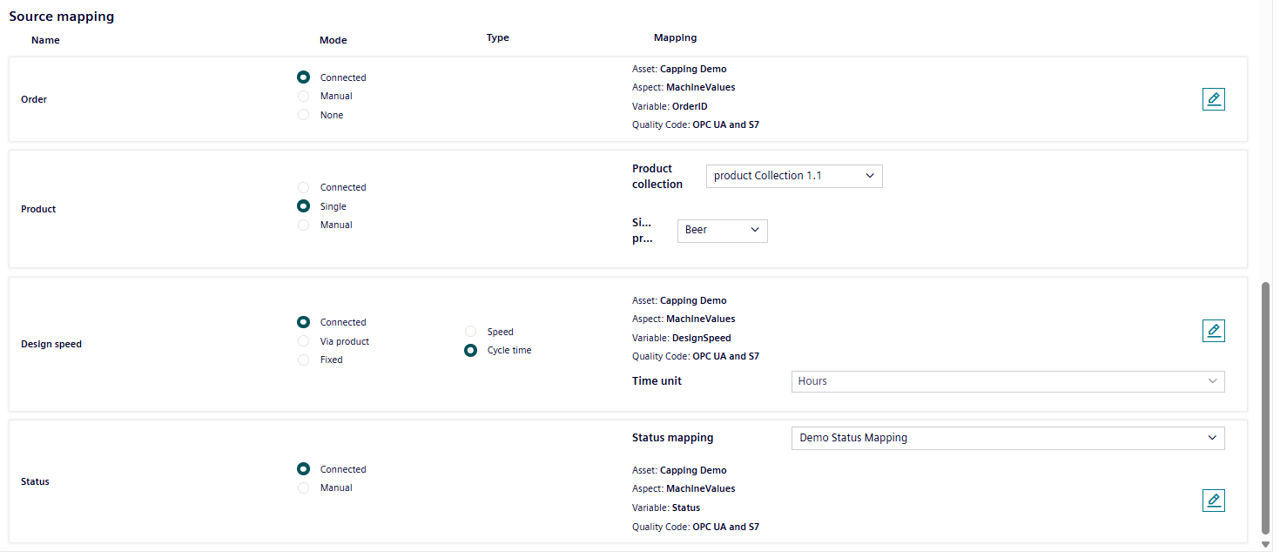
 6. For Status Mapping, select the relevant status mapping from the dropdown "Select Status Mapping".
It is recommended to create a Status Mapping in advance. For more information, refer to Configuring Status Mapping. 7. Once the applicable status mapping is selected, follow the same procedure to select a time series variable for the status.
The following screen shows the completed Source Mapping in the "Connected" mode:
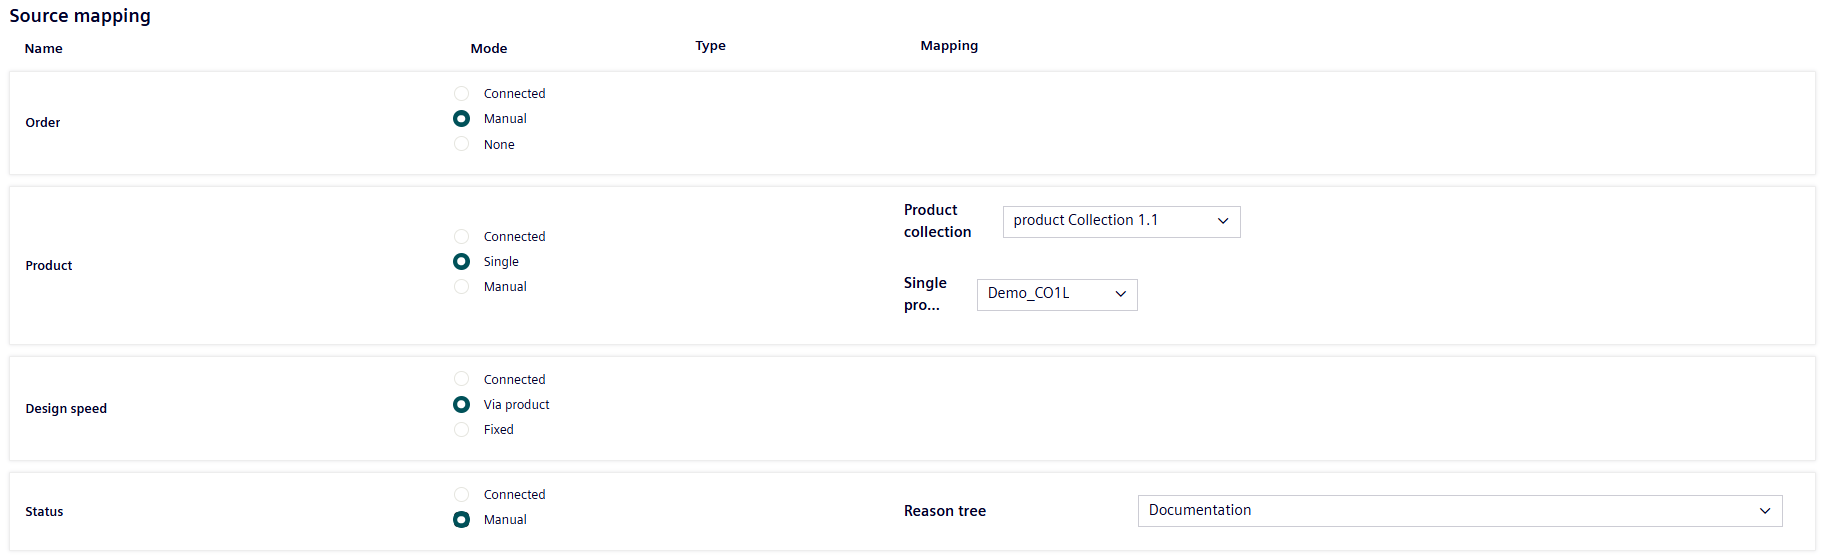
Manual Example
The second example shows a set-up for an all "Manual" Mode Source Mapping. The manual set-up does not require data mappings.
- Select "Manual" as the mode for the "Order". Enter the information in the manual inputs section for the order.
- Select "Manual" as the mode for the "Product". As a second step, you still need to select one product collection from the dropdown. Later, in the manual inputs section, assign one of the products from the product collection for the different time ranges.
- Select "Manual" as the mode for the "Status". In addition, select a reason tree from the dropdown, because you will be able to define the different machine states in a distribution based on the reason tree.
A complete manual mode setup is as displayed below:
Similarly to the Operand Mapping, many different combinations of Manual and Connected Modes are possible. You can select the appropriate one for your asset.
When both Operand and Source mappings are fully defined, then the asset is counted as an OEE asset and all of the KPIs will start to be calculated.
Note
There may be some time delay before KPI results are available to view in the analysis pages.