Process Optimization
The "Process Optimization" analysis view assists the user to select the optimal variable settings for their process. These are the settings that minimize energy consumption while maintaining the process reference throughput value.
On the first page, a scatter plot of Energy versus Reference is displayed. The values in blue are the training points used in the model building. These are the real observations of energy consumption for each batch of the process. The red points are the best observations in the training set, i.e those batches that minimize energy for a given value of the reference variable. The line connecting these points is called the Pareto front. The objective is to use optimization to find variable settings that do better than the observed Pareto front. This optimization uses a model to predict the energy resource and reference based on the value of the process variables. The active model button is shown above the chart. This leads to the Training Board where the user can review the model accuracy and configuration.
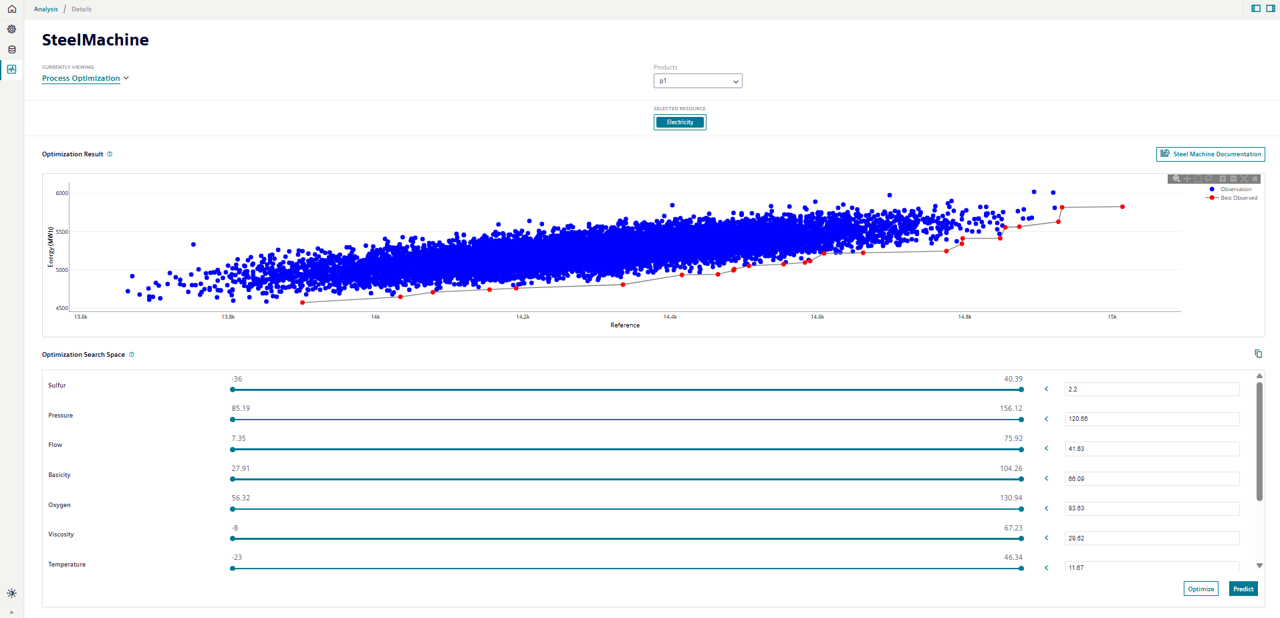
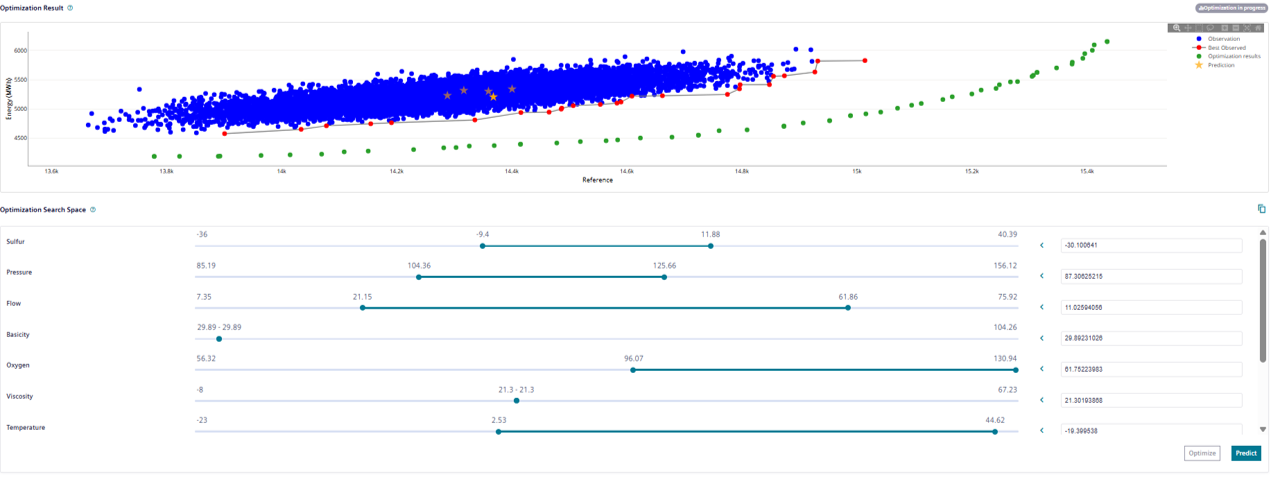
The application runs an optimization algorithm to search the space of variables. The limits on the variables are specified in the Optimization search space. For each variable, there is a slider showing its permissible range. The slider is used to set the upper and lower limits of the variable. There is also an input box where the user can enter a specific value for the variable. If any of these values change, then the "Predict" button is activated. This makes a single prediction of the energy and reference using the model. The result is shown in the chart as a yellow star. The latest prediction value is shown as a bold star, whereas the previous are transparent:

You can make multiple predictions to understand the relation between the process variables and the energy and find the best performing variable settings. However, with the optimization feature, this can be automatically done by clicking the optimize button. The built-in algorithm uses the model to search the variable space. The "Optimization in progress" symbol is displayed while waiting for the job to complete.
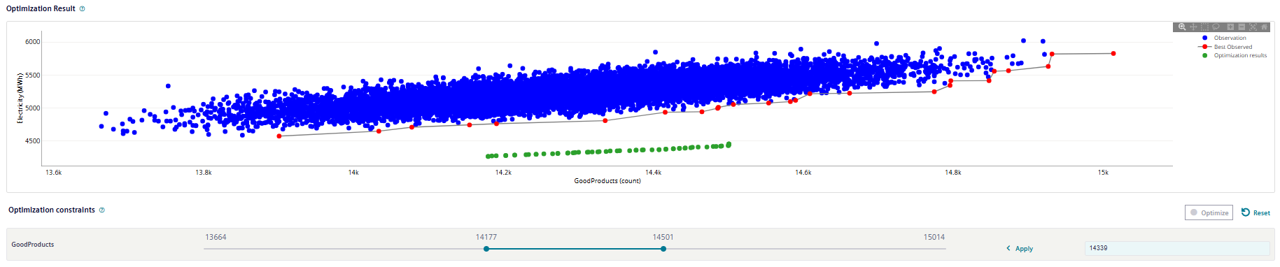
After completion, the chart shows the optimization results in green.

Each point is part of the new optimal set of solutions found by the algorithm. These solutions cover a range of reference values. So, you can select the one that corresponds to the current requirements of your production. For example, for some batches it may be sufficient to produce less than others. You can hover your mouse over the point and the tooltip will show the corresponding variable values. You can also select the point and this will enter the values into the variable input boxes. Click the  button and the values will be copied to your clipboard so that they can be pasted into other applications to help setup their process for the next batch.
You can limit the range of permissible values for the reference variable target using the slider in the 'Optimization constraints' box. This allows you to place realistic constraints on the results that reflect your production requirements. The algorithm then restricts the optimizer to search within this range. For example, we have restricted the range of 'GoodProducts' that we will produce in our process.
By default, the Optimization search space includes the full range of variables used in the model. Instead, you can change the search space using the sliders next to each variable. Drag the bars to set the upper and lower limits of each. You can also use the ![]() to fix the space to the value entered in the input box. Click "Optimize" and a new set of results are displayed:
to fix the space to the value entered in the input box. Click "Optimize" and a new set of results are displayed:
This process can be repeated. However, each new optimization result will overwrite any previous results. The latest optimization result persist when the application is closed and re-opened, but the prediction results are not preserved between sessions. You can delete the previous optimization and prediction results by pressing the reset button and confirming in the pop-up box.