Assets
Assets refer to the physical components, machinery, equipment and infrastructure deployed in industrial and operational environments. These are the critical elements whose performance, condition and operational efficiency are continuously monitored and managed by the Insights Hub solution.
In "Assets" section the following extensions are supported:
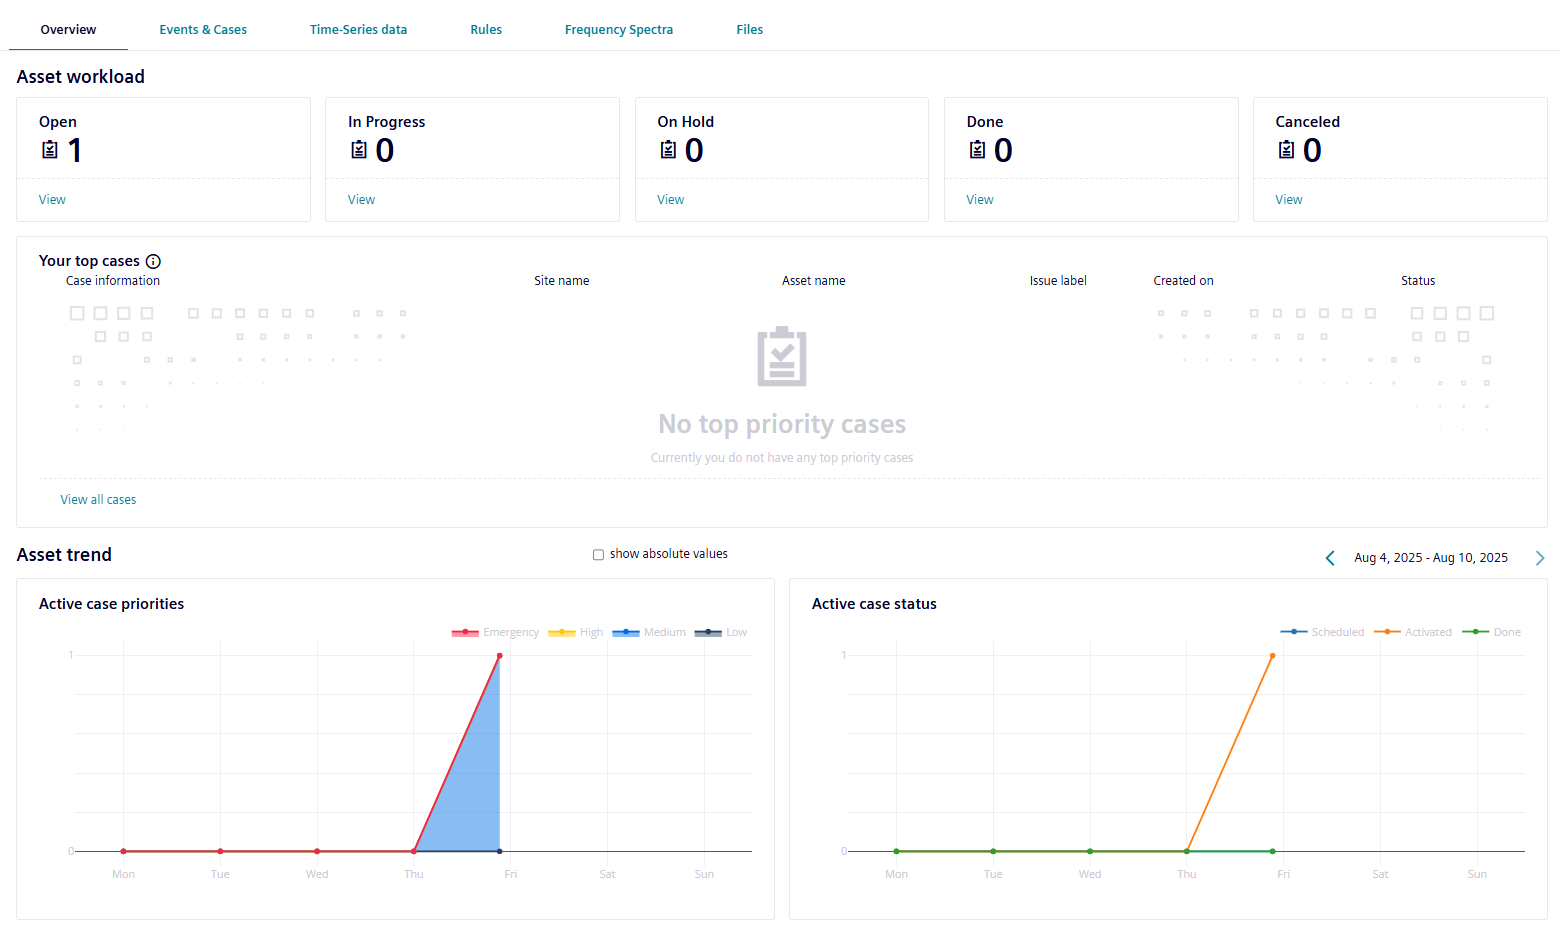
The "Overview" extension enables you to fetch the current and historical health and service information about an asset is displayed using common graphs and service KPIs to help service teams analyze the asset.
The "Events & Cases" extension enables you to fetch events and data variables information for your assets. This extension lists all the events created automatically while monitoring time series data of your asset via the rules engine. This extension also displays the static aspect details of an asset.
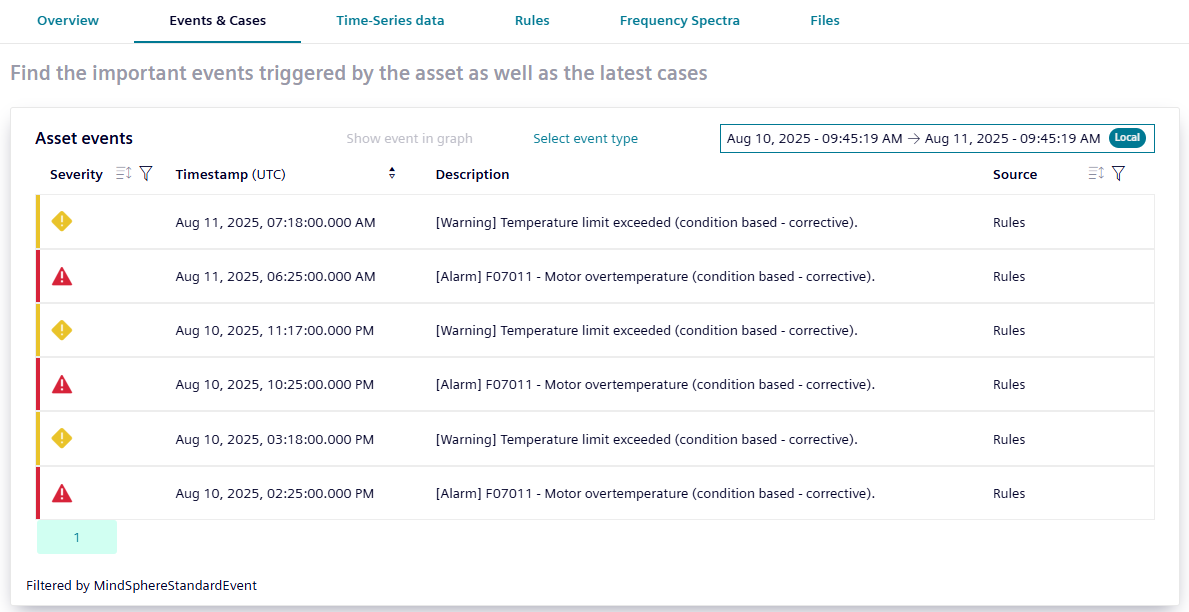
Events are the incidents created to trigger the variation in the asset data. These events are automatically created while monitoring your time series data via the rules engine. The event provides the following properties as shown in the table below:
| Property | Description |
|---|---|
| Severity | Describes the severity of the event. The following severities are available: - Error - Warning - Information |
| Timestamp | The timestamp where this event occurred. |
| Description | A description of what happened at this event. |
| Source | The source of the event, like "Rules" or another application or device. |
| Acknowledged | A Boolean value which indicates the state of this event, if a user has already acknowledged this event, or if this is a new event. - New events have acknowledged state "false" - Acknowledged events have state "true" |
The severity is an integer value with the following meaning:
| Description | Number |
|---|---|
| Error | 20 |
| Warning | 30 |
| Information | 40 |
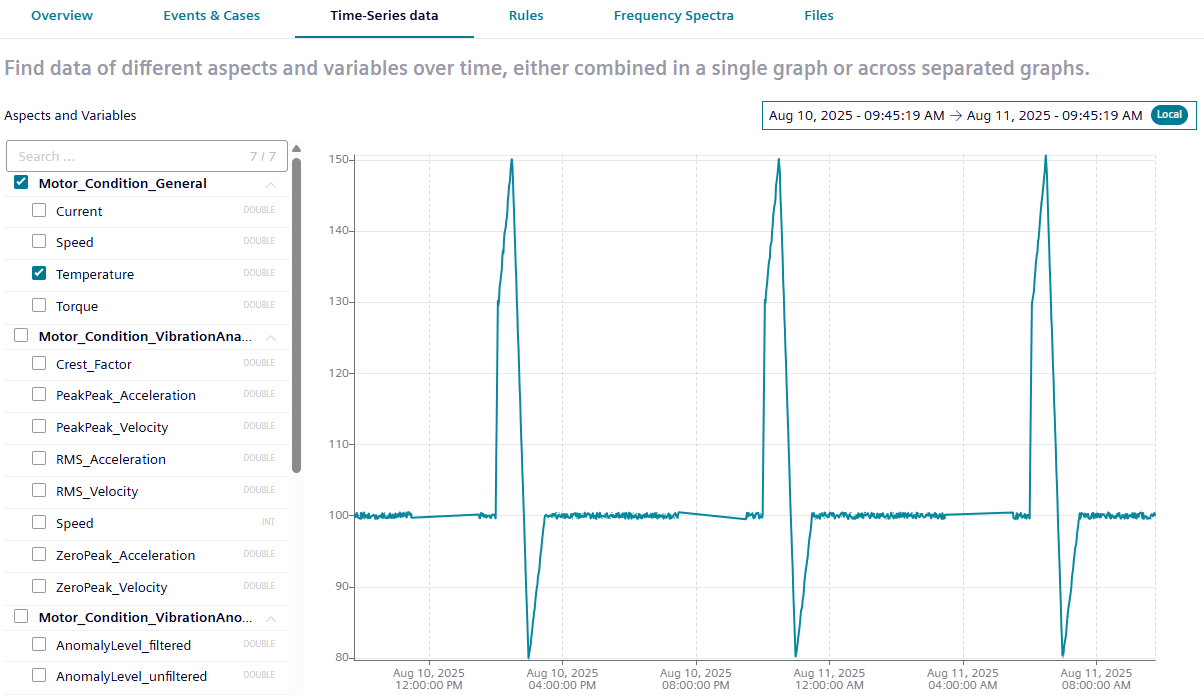
The "Time series data" extension allows you to visualize the signal data based on time in order to analyze the possible cause impacting the machine downtime. The "Time series data" extension supports the datatypes which have been defined for this asset type for the visualization of the variables of each aspects. The data of the signals are displayed in the chart view as line diagrams.
This extension supports the visualization of the signal data of the assets for the configured variables in the following ways:
- Single graph with multiple signals
- Multiple graphs with a single signal and events
Visualizing multiple signals in a single graph
Time series data extension allows you to visualize the signal data of all the variables configured for the asset in a single graph to compare the variations at once.
To visualize the data, follow these steps:
- In the "Time series data" extension, click "Single Graph with multiple signals".
- Select the variables to be visualized.
- Select the required time period from the timestamp.
The graph for the selected signals is displayed.
Visualizing Individual signal and events in multiple graphs
Time series data extension also allows you to visualize the signal data or events of the individual variables separately.
To visualize the data, follow these steps:
- In the "Time series data" extension, click "Multiple graphs with a single signal and events".
- Select the variable to be visualized under the aspect of your choice.
- Select the required time period from the timestamp.
The graph of the selected variable is displayed.
The "Rules" extention automatically triggers events or cases to notify about the possible failure of an asset. It detects the overshooting or undershooting of a defined threshold value and creates an event and case. You can define the exact threshold value in the rule configuration. The rule automatically logs each deviation with an event.
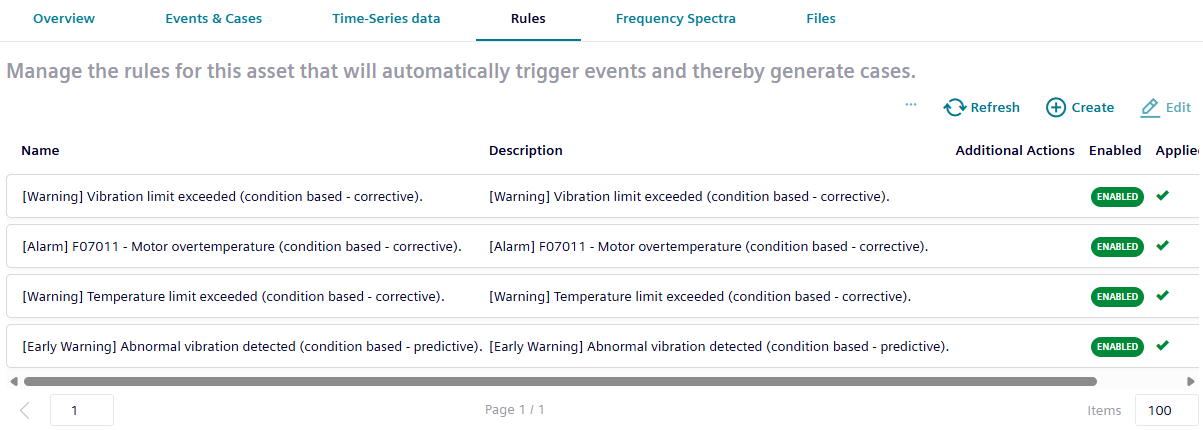
Create a Rule
For an instance of an asset, you can create a rule. To create a rule, follow these steps:
- In the left navigation, click "Assets".
- Select "Rules" extention.
- Click
 .
. -
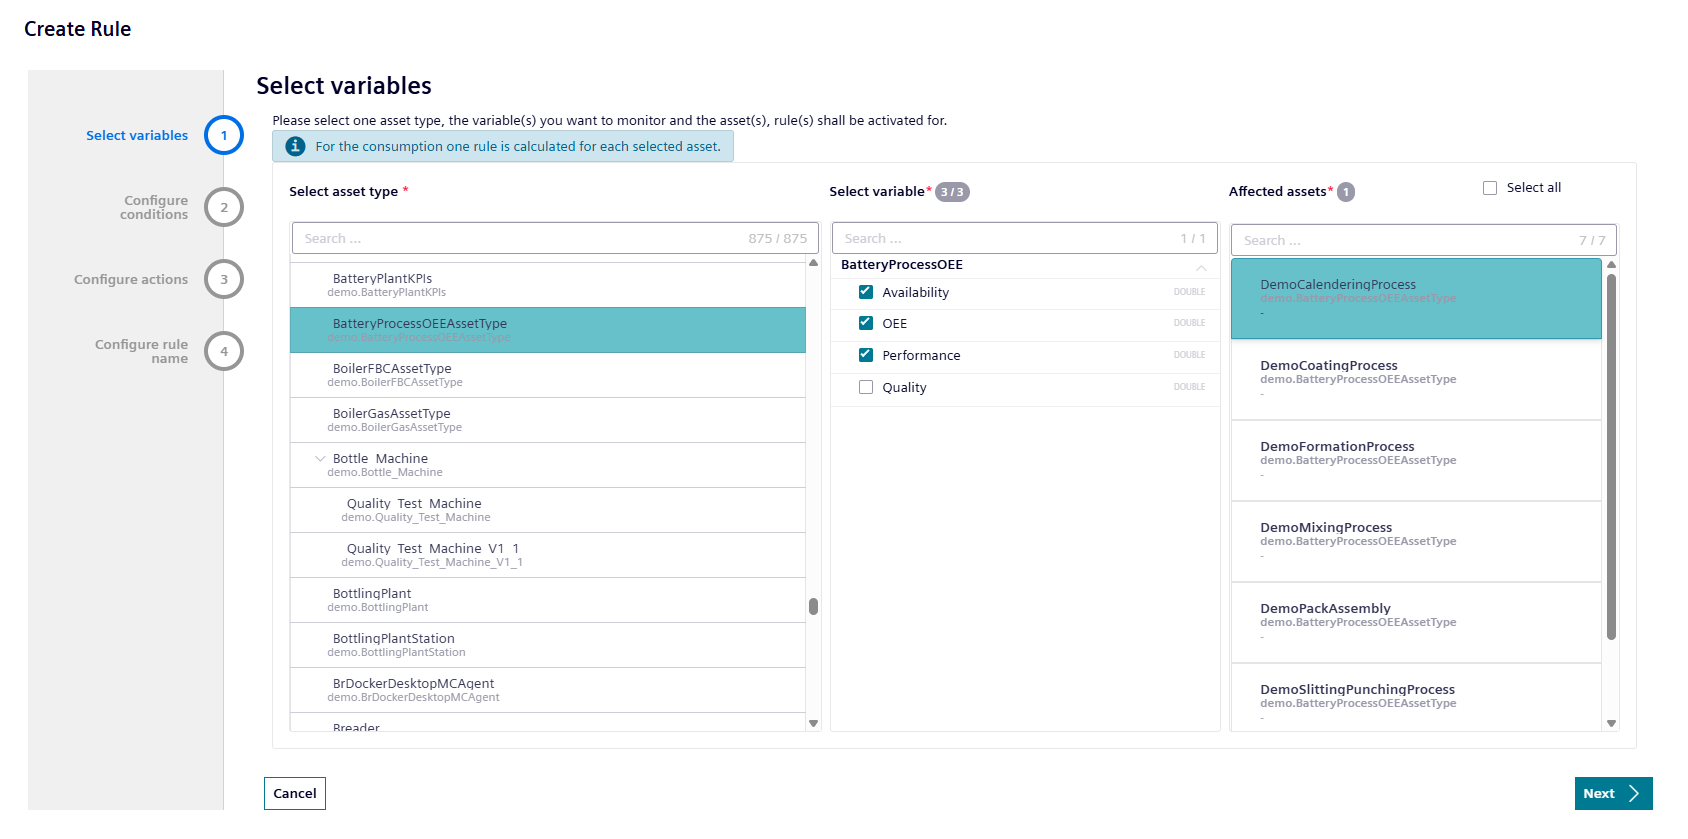
In the "Select variables" section,
- Select the respective asset type.
- Select the affected assets from the corresponding list.
- Select the variables from the corresponding list. You can select up-to three variables.
- Click "Next".
-
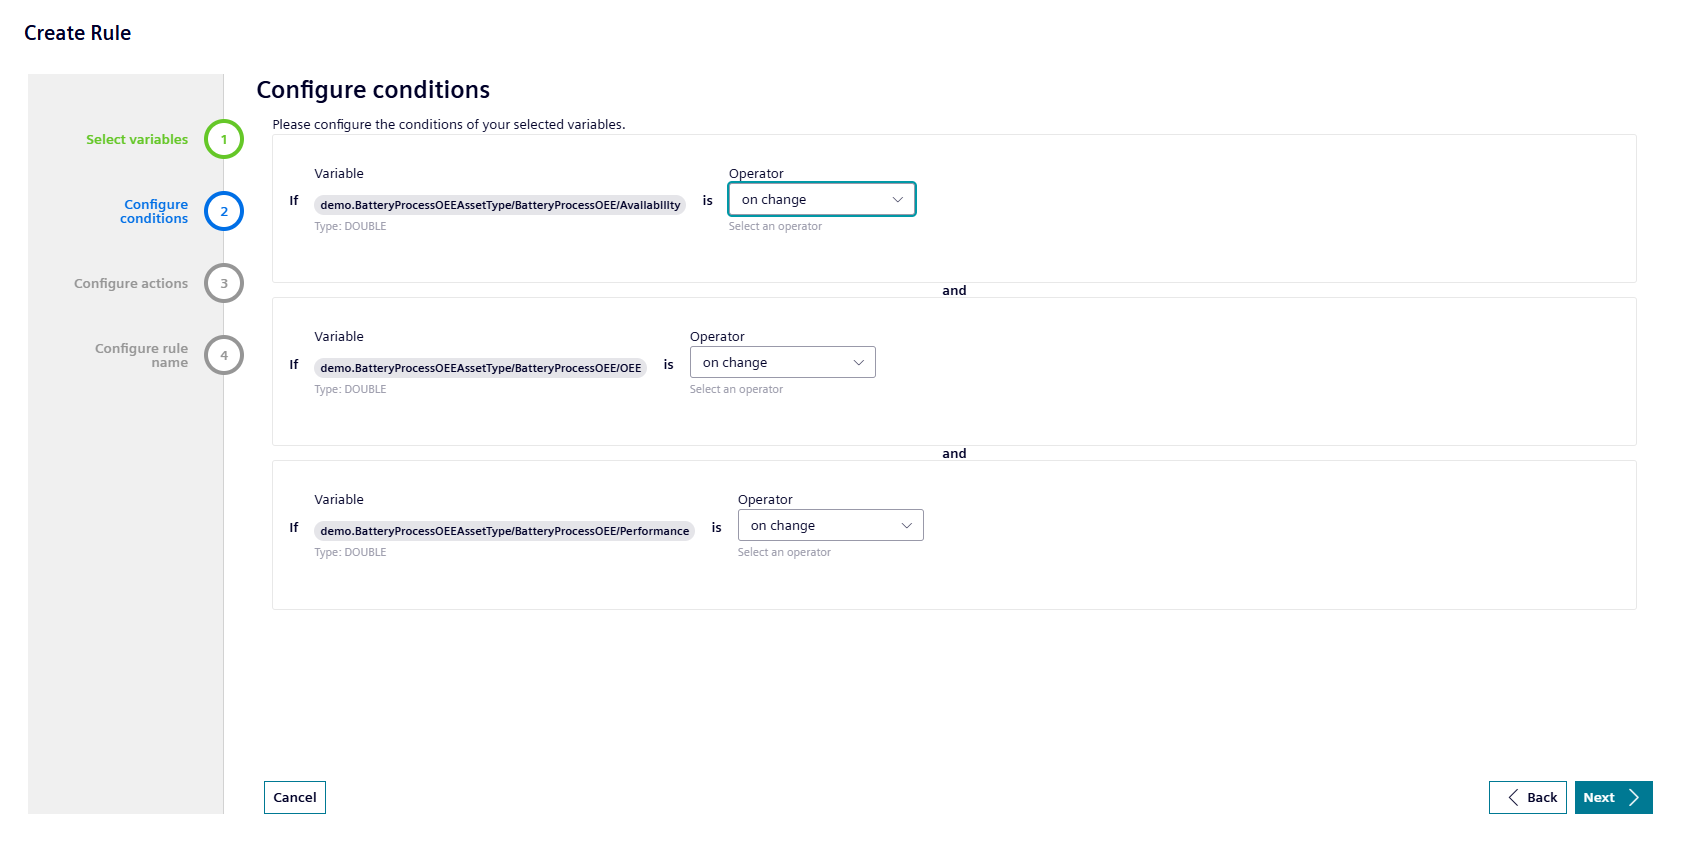
In the "Configure conditions" section,
- Select the "Operator" from the dropdown menu to configure the conditions of the selected variables.
- Click "Next".
-
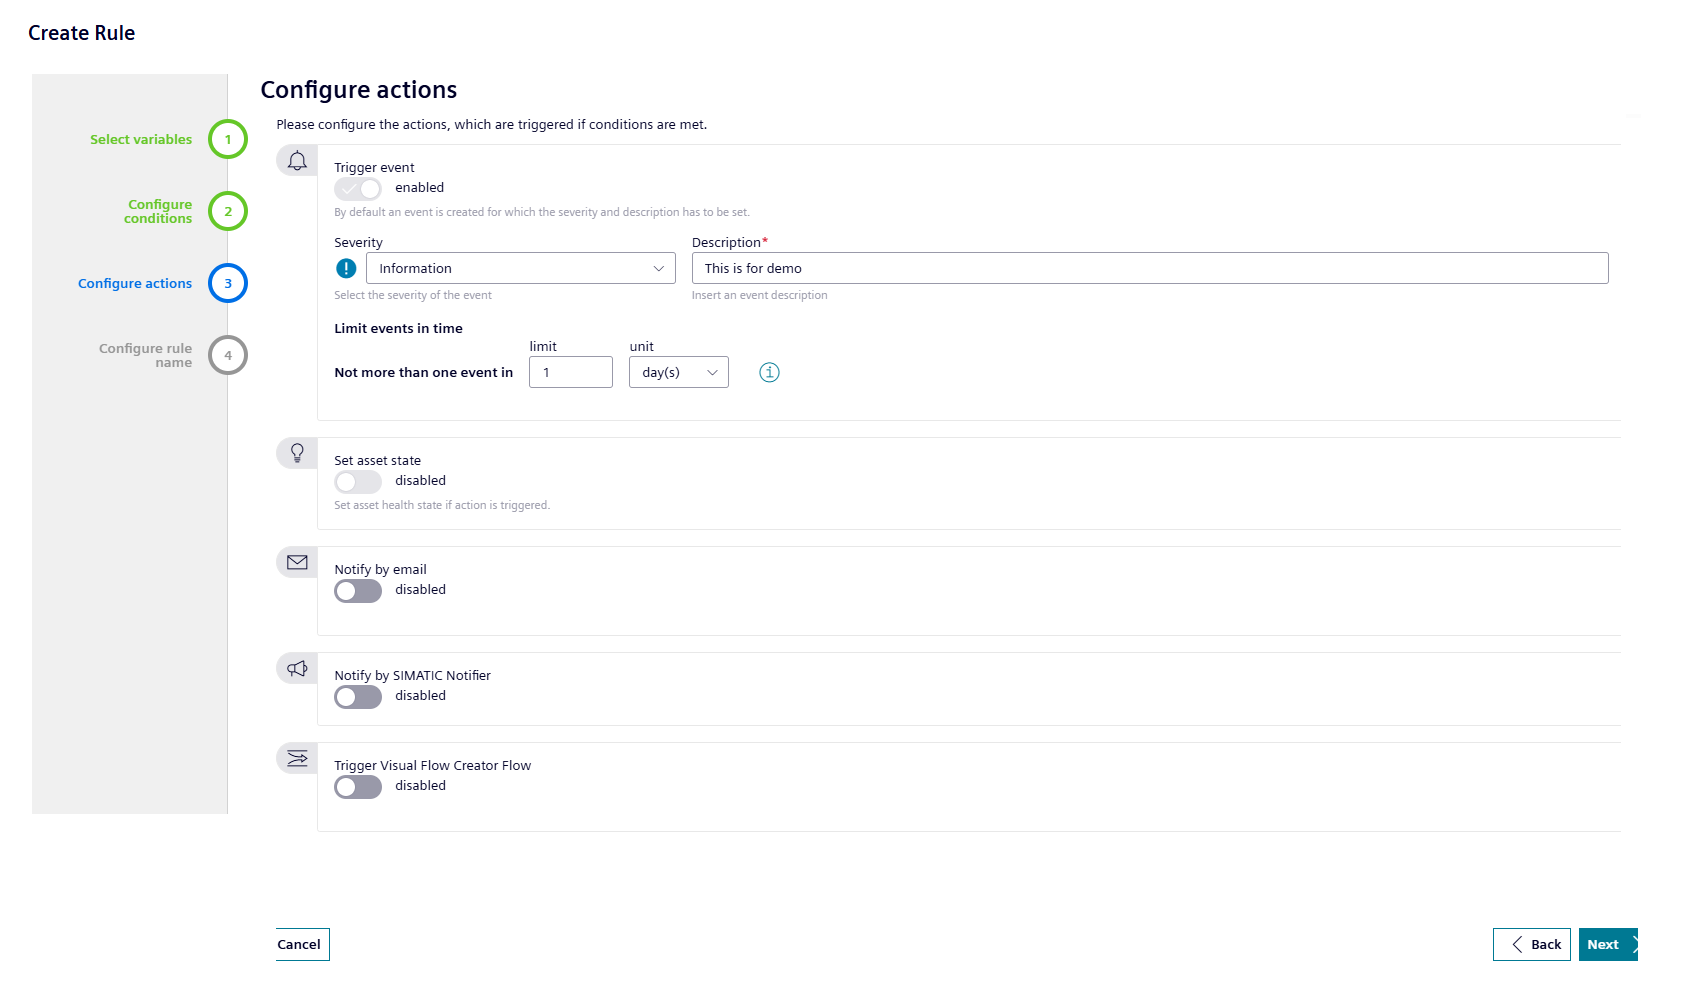
In the "Configure actions" section,
- Select the respective "Severity" from the dropdown menu.
- Enter the "Description".
- Choose the limit of the number of events over time and select the unit from dropdown menu.
Note
- To send an email, enable the toggle button of "Notify by email" and enter the email address.
- To notify by SIMATIC Notifier, enable the toggle button of "Notify by SIMATIC Notifier".
- To enable Visual Flow Creator", enable the toggle button of "Trigger Visual Flow Creator Flow" and select the rules trigger.
-
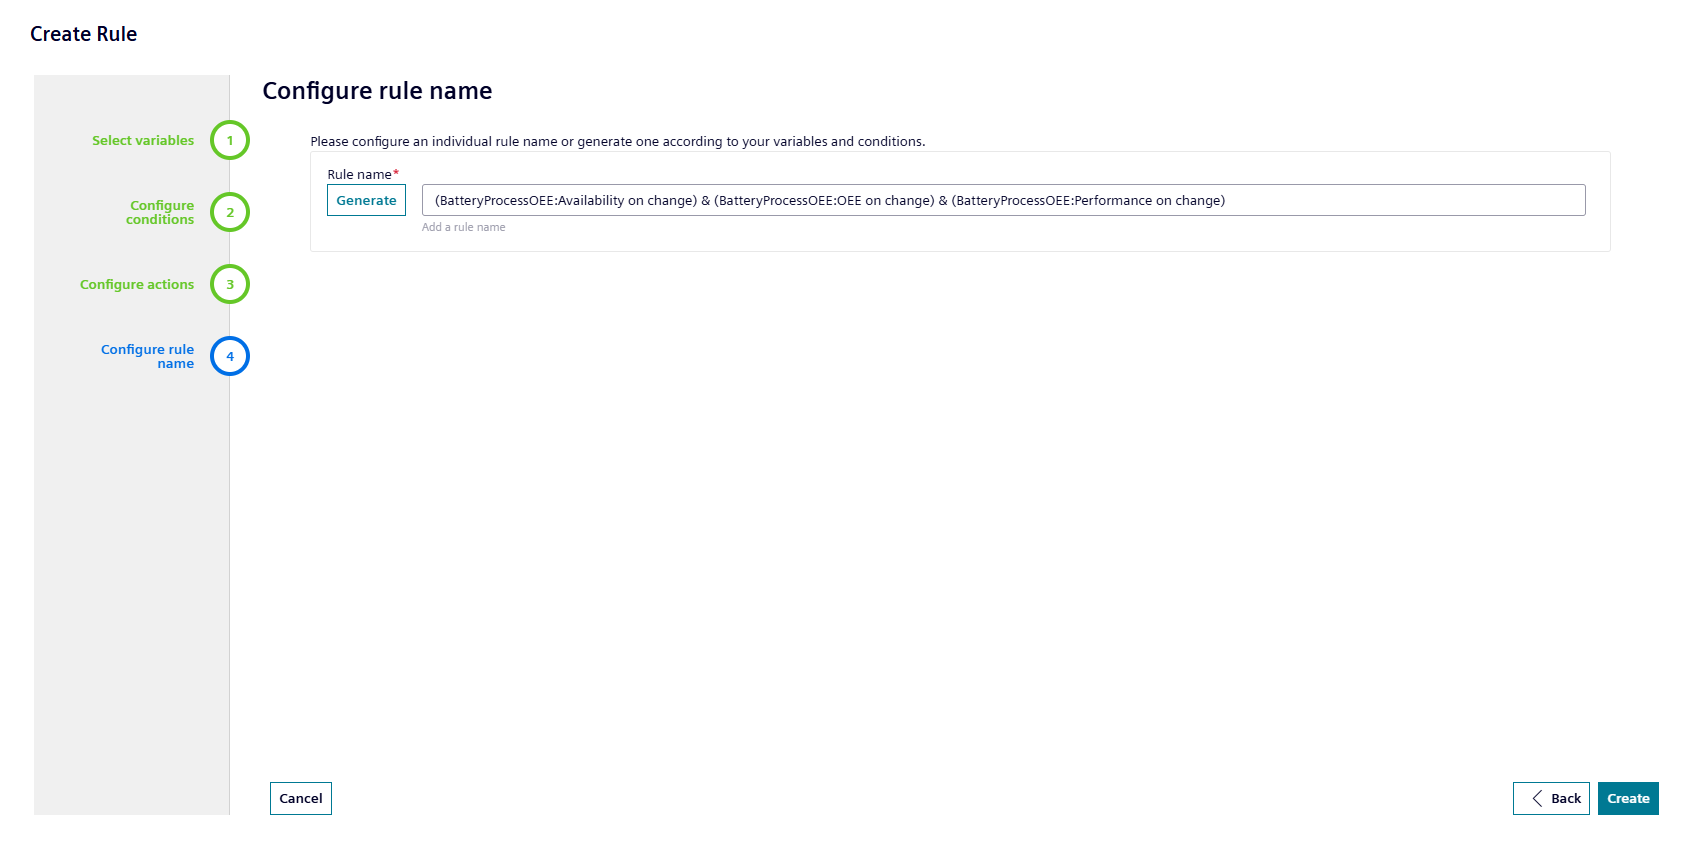
In the "Configure rule name" section,
- To add a rule name, click "Generate".
- Click "Create".
The "Frequency Spectra" extension allows you to visualize the signal data based on frequency in order to analyze the possible cause impacting the machine downtime. The "Frequency Spectra" extension supports the datatypes which have been defined for this asset type for the visualization of the frequency signals.
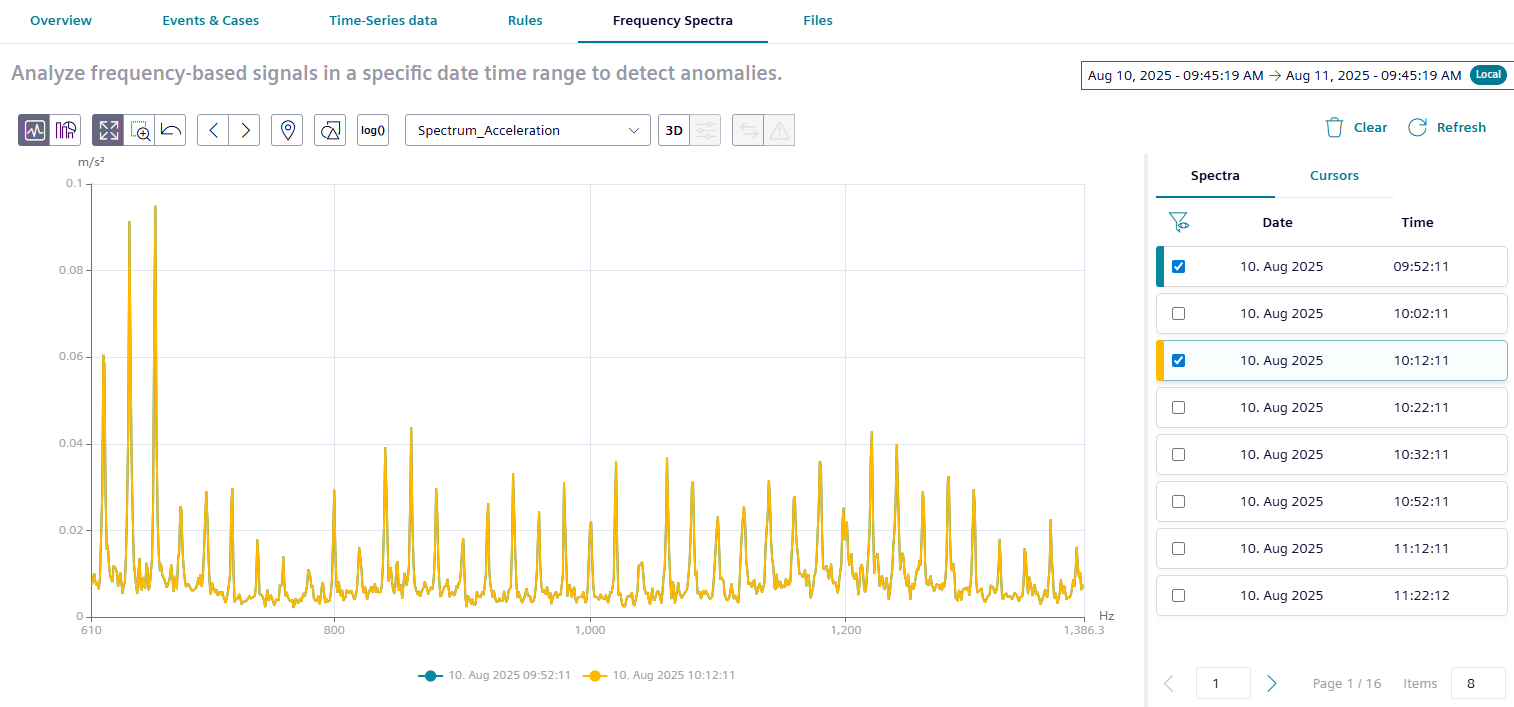
The analysis package "Frequency Spectra" extension analyzes the frequency signals by calculating selected spectral quantities (Fast Fourier Transformation) such as frequency-based acceleration, acceleration envelope and velocity spectra. These quantities can be used to evaluate the spectral composition of the given input signal considering a fixed frequency range (speed independent) and allows an early detection of mechanical fault of rotating equipment. The service engineers can compare this frequency graph with the reference graphs to predict the possible fault resulting in the possible machine downtime.
Frequency Markers
While visualizing the frequency data, if you identify any critical frequency, add a marker for future reference. This frequency markers allows the user to compare the current spectrum with pre-configured critical frequencies and their harmonics. This comparison further helps the engineers in performing the basic analysis.
Visualizing Frequency Signal data
To visualize the frequency data, follow these steps:
- In the "Frequency spectra" extension, select the required date and time range.
- Click "Apply".
- Select the spectrum from the "Files" list.
The graph of the selected frequency is displayed. - Compare the frequency data with the available reference graphs and the frequency markers to detect the possible faults in the asset.
The "Files" extension provides you with a secure way to upload, save or open files for the devices.
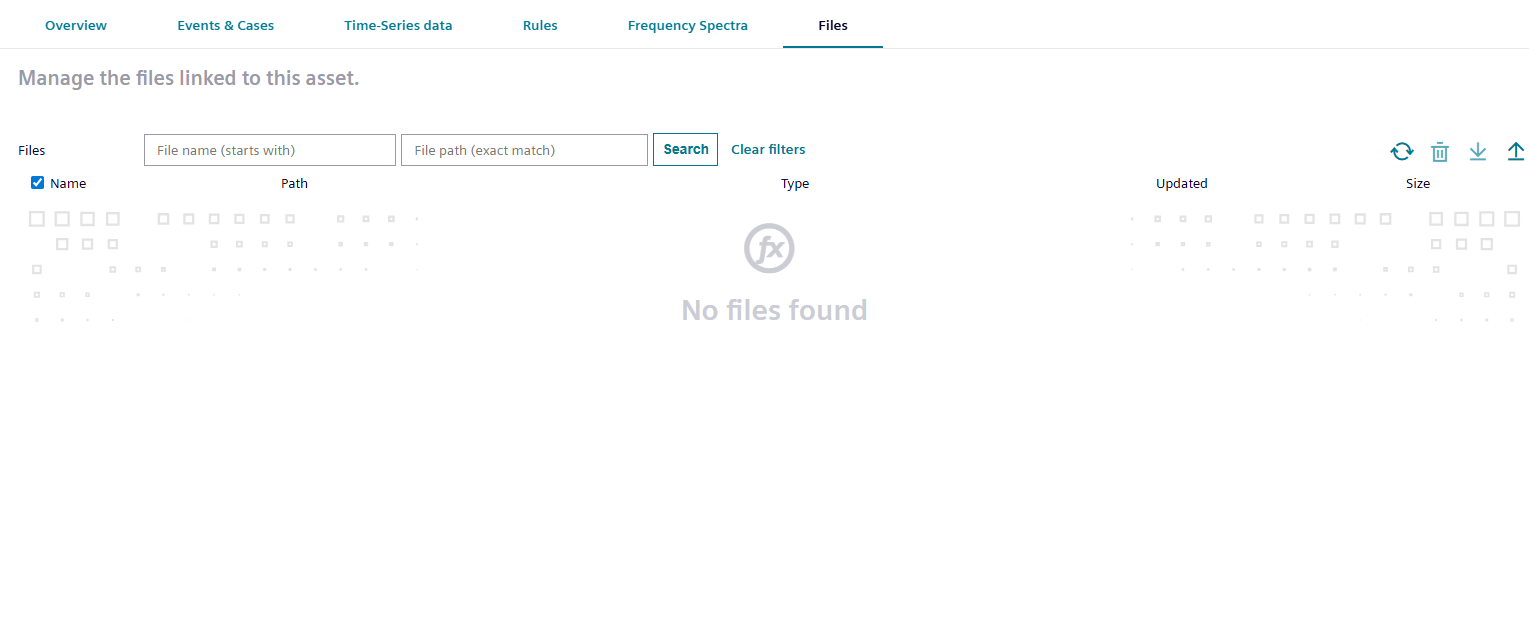
It offers you the following functions:
- Upload, download and delete files for your assets
- Upload and manage files
- Search and sort files
Uploading files to the "Files" extension consumes space in your environment, even if it is done by another user.