The Opcenter Intelligence data source for Dashboard Designer
The Opcenter Intelligence data source allows you to display Opcenter Intelligence Manufacturing Data Warehouse (MDW) data (by means of its OData interface) in Insights Hub Dashboard Designer. Opcenter Intelligence manufacturing data warehouse contains data ingested from Manufacturing Execution System (MES) products. This data is used to contextualize Insights Hub OEE and Insights Hub IoT data.
You can refer to Opcenter Intelligence for Cloud Reference Manual for more information on:
- Opcenter Intelligence manufacturing data warehouse entities and their content.
- Opcenter Intelligence supported OData functionalities.
For more information on how to configure and use Opcenter Intelligence, refer to Opcenter Intelligence for Cloud User Manual.
Opcenter Intelligence documentation is available to customers who sign in to Support Center with Insights Hub/Siemens ID credentials.
Prerequisites
- You have configured an Opcenter Intelligence solution and deployed the environment.
- The Data Exposition Service to read data from Opcenter Intelligence manufacturing data warehouse has been activated.
Creating an Opcenter Intelligence data source query
- Click "Dashboards" in the left-hand navigation menu.
- Click "New" and select "New dashboard" from the drop-down list.
- Click "+ Add visualization".
- Select "Opcenter Intelligence" from the data source list.
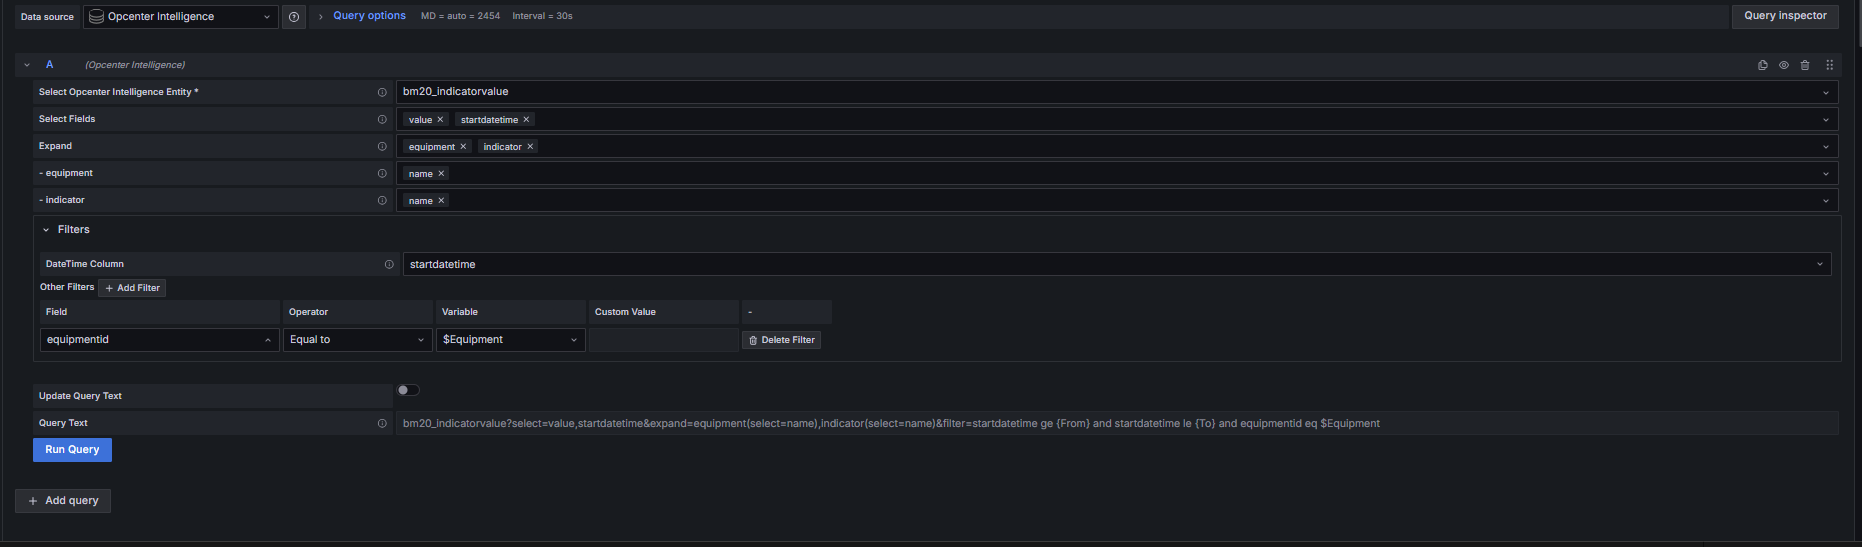
- On Insights Hub Dashboard Designer Query page, click "Select Opcenter Intelligence Entity" and choose an entity from the list (this is the OData entity for the query). Entities may differ depending on the configuration. The format of manufacturing data warehouse entities is "bm20_entity name", while entities configured for smart views have the "smart view name_entity name" format.
- Choose the relevant columns of the entity by selecting the "Select Fields" option. If this field is left empty, all columns are selected.
- (Optional) Click "Expand" to choose the entities that have a direct relationship with the entity selected in the previous step and their relevant information. For example, you can expand the site and equipment fields to further explore related data. Once you have selected a related entity, a row with the name of the entity is added where its columns can be selected. You can expand entities up to three levels.
- Select the MDW entity: the "+ Add filter" button is enabled.
- Set the "DateTime Column" to choose date and time entity if in your visualizations you need to filter data based on time. If no date and time is displayed, it means no datetime columns are available. For more details, see Using DateTime Columns in Opcenter Intelligence data source.
- Click "+ Add Filter" to define one or more filters. Multiple filters are applied with the AND operator.
- Under the Field column, select the fields where you want to apply the filter. You can select all fields, including those you can navigate by means of the navigation properties.
- Under the Operator column, select the operator to apply to the field. Values vary depending on the field selected in the previous step. If you are using a Multi-value variable, you have to select the IN operator.
- Select a variable you have previously created. For details, see Creating an Opcenter Intelligence dashboard variable. Alternatively, you can add a custom value.
- The final OData query is automatically generated and displayed in the Query Text area. Use the "Update Query Text" option to manually edit this query if you want to add further filters or other oData query options.
- Click "Run Query". The requested data is shown in the panel. Proceed configuring your visualization(s) according to your requirements.
Note
The maximum number of allowed rows is 10,000. If this limit is reached, the following error message is returned: "The maximum number of allowed rows (10000) has been reached".
Dashboard Variables
You can configure query variables to fetch dynamic data from Opcenter Intelligence data source and fill in the values to be chosen in your dashboards. Variables are available for all dashboards and visualizations. You can also create and use variables from a different data source, for example Insights Hub OEE, and filter data for the data source that contains the variable.
Creating an Opcenter Intelligence dashboard variable
- Select "Dashboard Settings".
- Choose the "Variables" tab and click "Add Variable".
- Set the parameters to configure the variable:
- select the variable type from those available (Query, Text Box, Custom or Constant)
- enter a suitable name for the variable
- select "Opcenter Intelligence" as data source
- Click "Select Opcenter Intelligence Entity" and choose an entity from the list.
- Choose the relevant entities by selecting the "Select Fields" option: the query is automatically generated and displayed in the Query Text field.
- (Optional) Select how to sort the variable values (disabled by default).
- In the "Selection" options section, select either the "Multi-value" option to allow the selection of multiple values, or the "Include All" option to select all values at once: in the Preview of values area, the available values for the variable are shown.
- Click "Apply" and save the dashboard.
Using DateTime columns in Opcenter Intelligence data source
When filtering data by time, it is recommended to use columns containing datetime in UTC format, considering the following facts:
- In the bm20 schema, all datetime columns are in UTC format, except those with "local" in their name.
- In smart views, datetime columns are in local time by default, except those with "UTC" in their name.
- Local time refers to the time zone of the site associated with the data.
If you filter data by time using a column in UTC format, the selected date is automatically converted into UTC.
Example