Apache ECharts
Apache E Charts are a powerful, interactive and open source charting and visualization library based on JavaScript and TypeScript code.
Dashboard Designer V10 provides an interface to integrate Apache ECharts into any of the dashboards. With this integration, it is possible to create advanced visualizations in Dashboard Designer. This is done by adding JavaScript code, thereby personalizing your widgets so that the visualization is adapted to the data.
This section describes the steps to include Apache ECharts into your dashboard.
Insights Hub Dashboard Designer Apache ECharts video 
Adding Apache ECharts
To include Apache ECharts to your dashboard, proceed with the following steps:
- Access the Apache ECharts website to choose the required widget from the available list.
- Copy the JavaScript/TypeScript code.
- Access the Dashboard Designer application from the Insights Hub Launchpad.
-
Select your dashboard for which an Apache EChart widget needs to be added.
If there are no dashboards available, it is required to create a new one. For more information, refer to Creating Dashboards.
-
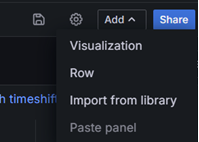
Click "Add" and then select "Visualization".
-
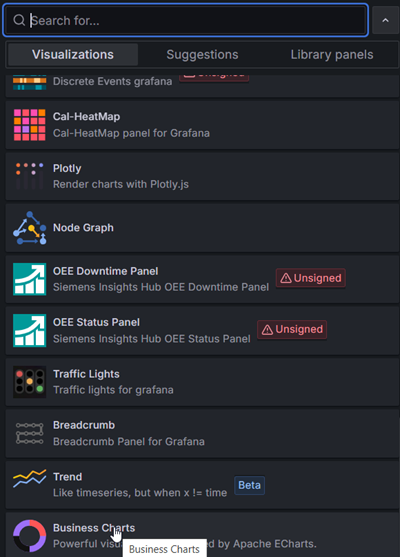
From the visualization drop-down, select "Business Charts".
-
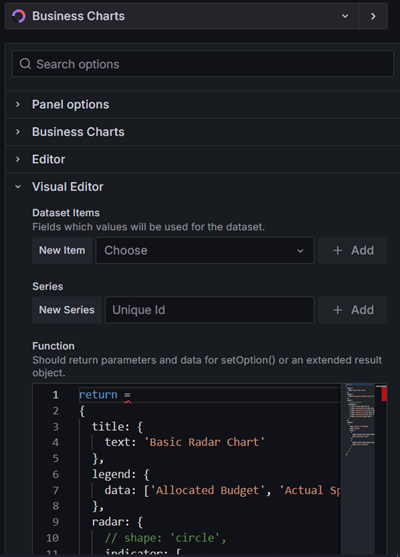
Expand the "Visual Editor" option. In the "Function" section, paste the basic radar code copied from the Apache Echart website.
-
Replace
optionwithreturnin the "Function" section, to run this radar chart. Click the widget preview section in the middle of your screen to display the chart. -
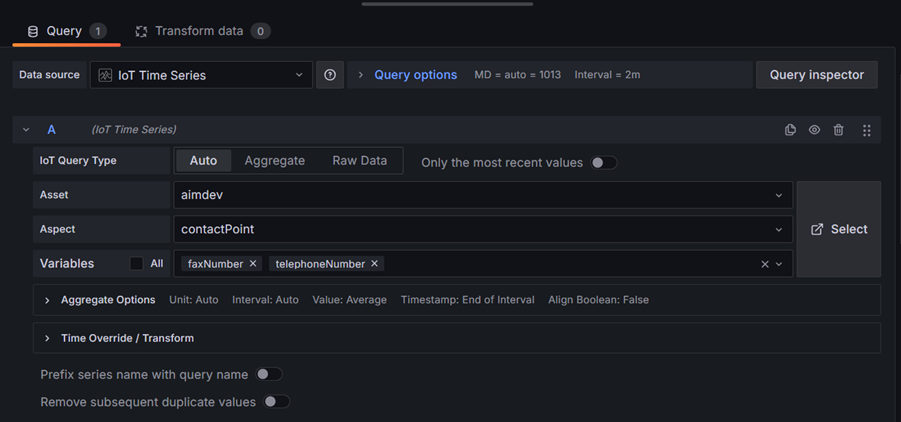
To add your own data to the chart, select the required asset and its associated aspect in the "Query" section.
-
Choose the required variables. To add more queries, click "Add query" and select the required data.
-
Enter the following code above the "return" section. The sample code is as shown below:
const data = context.panel.data; const echarts = context.echarts; const echartsInstance = context.panel.charts; console.log(data); const data1m = data.series[0].fields[1].values.map(v => v.toFixed(2)); const data2m = data.series[0].fields[2].values.map(v => v.toFixed(2)); const data3m = data.series[0].fields[3].values; const data4m = data.series[0].fields[4].values; const data5m = data.series[0].fields[5].values.map(v => v.toFixed(2)); const deta1l = data.series[1].fields[1].values.map(v => v.toFixed(2)); const deta2l = data.series[1].fields[2].values.map(v => v.toFixed(2)); const deta3l = data.series[1].fields[3].values; const deta4l = data.series[1].fields[4].values; const deta5l = data.series[1].fields[5].values.map(v => v.toFixed(2)); return = { title: { text: 'Basic Radar Chart' }, legend: { data: ['Munich', 'London'] }, radar: { // shape: 'circle', indicator: [ { name: 'Cleaning time', max: 35 }, { name: 'Fault time', max: 15 }, { name: 'Number of units produced', max: 300 }, { name: 'Rejects', max: 18 }, { name: 'Set up time', max: 30 }, ] }, series: [ { name: 'Budget vs spending', type: 'radar', data: [ { value: [data1m.pop(), data2m.pop(), data3m.pop(), data4m.pop(), data5m.pop()], name: 'Munich' }, { value: [data1l.pop(), data2l.pop(), data3l.pop(), data4l.pop(), data5l.pop()], name: 'London' } ] -
Click "Apply" to switch back to the dashboard.