Analyzing coroutines
Coroutines execute differently from other script code. Most script code in Unity appears within a performance trace in a single ___location, beneath a specific callback invocation. However, the CPU code of coroutines always appears in two places in a trace:
All the initial code in a coroutine, from the start of the coroutine method until the first
yieldstatement, appears in the trace whenever Unity starts a coroutine. The initial code most often appears whenever theStartCoroutinemethod is called. Coroutines that Unity callbacks generate (such asStartcallbacks that return anIEnumerator) first appear within their respective Unity callback.The rest of a coroutine’s code (from the first time it resumes until it finishes executing) appears within the
DelayedCallManagerline inside Unity’s main loop. This is because of the way that Unity executes coroutines. The C# compiler auto-generates an instance of a class that backs coroutines. Unity then uses this object to track the state of the coroutine across multiple invocations of a single method. Because local-scope variables within the coroutine must persist acrossyieldcalls, Unity elevates the scope of local variables into the generated class, which remain allocated on the heap during the coroutine. This object also tracks the internal state of the coroutine: it remembers at which point in the code the coroutine must resume after yielding.
For these reasons, the memory allocated when a coroutine starts is equal to a fixed overhead allocation plus the size of its local-scope variables.
The code that starts a coroutine constructs and invokes an object, and then Unity’s DelayedCallManager invokes it again whenever the coroutine’s yield condition is satisfied. Because coroutines usually start outside of other coroutines, this splits their execution overhead between the yield call and DelayedCallManager.
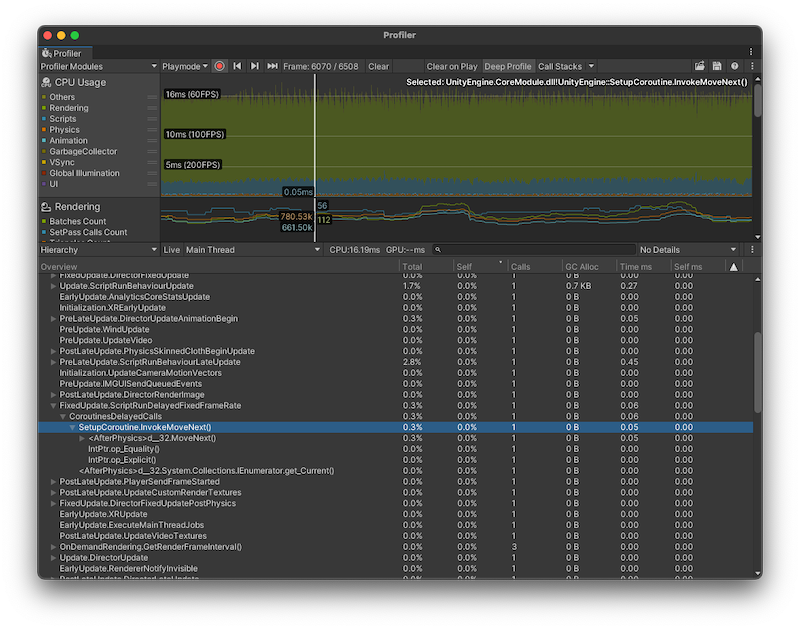
Monitor and improve coroutine performance
You can use the Unity ProfilerA window that helps you to optimize your game. It shows how much time is spent in the various areas of your game. For example, it can report the percentage of time spent rendering, animating, or in your game logic. More info
See in Glossary to inspect and understand where Unity executes coroutines in your application. To do this, profile your application with Deep Profiling enabled, which profiles every part of your script code and records all function calls. You can then use the CPU Usage Profiler module to investigate the coroutines in your application.
It’s best practice to condense a series of operations down to the fewest number of individual coroutines possible. Nested coroutines are useful for code clarity and maintenance, but they impose a higher memory overhead because the coroutine tracks objects.
If a coroutine runs every frame and doesn’t yield on long-running operations, it’s more performant to replace it with an Update or LateUpdate callback. This is useful if you have long-running or infinitely looping coroutines.